6000kW Solar Project for Lawrenceville School- Schematic Design Phase
Project Data
End-User: Lawrenceville School
Installer: Lighton Industries
Location: Lawrenceville, New Jersey
Date of install: May 2012
Size of system in kW: 6000kW
Energy produced since installation: ~27GWh
Special Challenges Met: Environmentally Protected Farming Land
Project Brief
THE LAWRENCEVILLE SCHOOL SOLAR PROJECT
Project Developer: TurtleEnergy LLC, Date Built: 2012
Client: Sold to KDC Solar
Project: 6MW on thirty acres of single axis trackers, 500kW MV inverters
Cost of project: $28M, Date Energized: May 2012
John Millard's Role- principal in charge/ owner/ primary end user contact.
Civil, environmental, structural, mechanical consultant – Innovative Engineering; Wall, NJ
Permits required- NJDEP; Wetlands LOI, Flood Hazard Applicability Determination. NJ Department of Transportation- Permit to create curb cut on State Road 206. Township of Lawrence Zoning Board- Variance from Environmentally Protected Agricultural Zoning to Commercial Zoning Code. PSE&G interconnection permit, NJCEP SREC permit.
Role by John Millard: 1) Found TurtleEnergy 2003, 2) Sell Company Capabilities to Client in Nov. 2009, 3) Compete with two other companies to win $28M project, 4) Build project team to execute project, 5) Engage and Coordinate Engineering Consultants for Permits, 6) Negotiate Power Purchase Agreement, 7) Provide Due Diligence Design for Lender's Engineer to evaluate and validate for $15M non-recourse financing, 7) Estimate Annual Electricity Production for 20 year Production Guaranty, 8) Evaluate Mounting Hardware solutions for review, 9) Negotiate Procurement Contracts and Project Specific Warranties with Manufacturers of Inverters, Solar Modules, Mounting Hardware and Cable Tray. 10) Lead Site Layout and Subsurface Conduit Route for Permits, 11) Primary Liaison with Client, 12) Primary Legal Negotiator for Developer 13) Expert Witness at Zoning Board of Adjustment Hearing, 14) Negotiate SREC contracts with Load Serving Entities and SREC Brokers.
Project Achieved Zoning Approval in November of 2011 as well as all NJDEP Permits and NJDOT Permits- Project was sold to investors in April of 2011 and construction commenced in October of 2011, energizing in May of 2012 (commercial operations).
John Millard was the principal in charge of this $28M solar PV project. Millard introduced the concept of purchasing electricity from an on-site solar project to the school leadership and led the project development as well as the power purchase negotiations. Millard's company, TurtleEnergy, competed against two other utility scale project companies to win the 9000MWh / Year contract and prevailed.
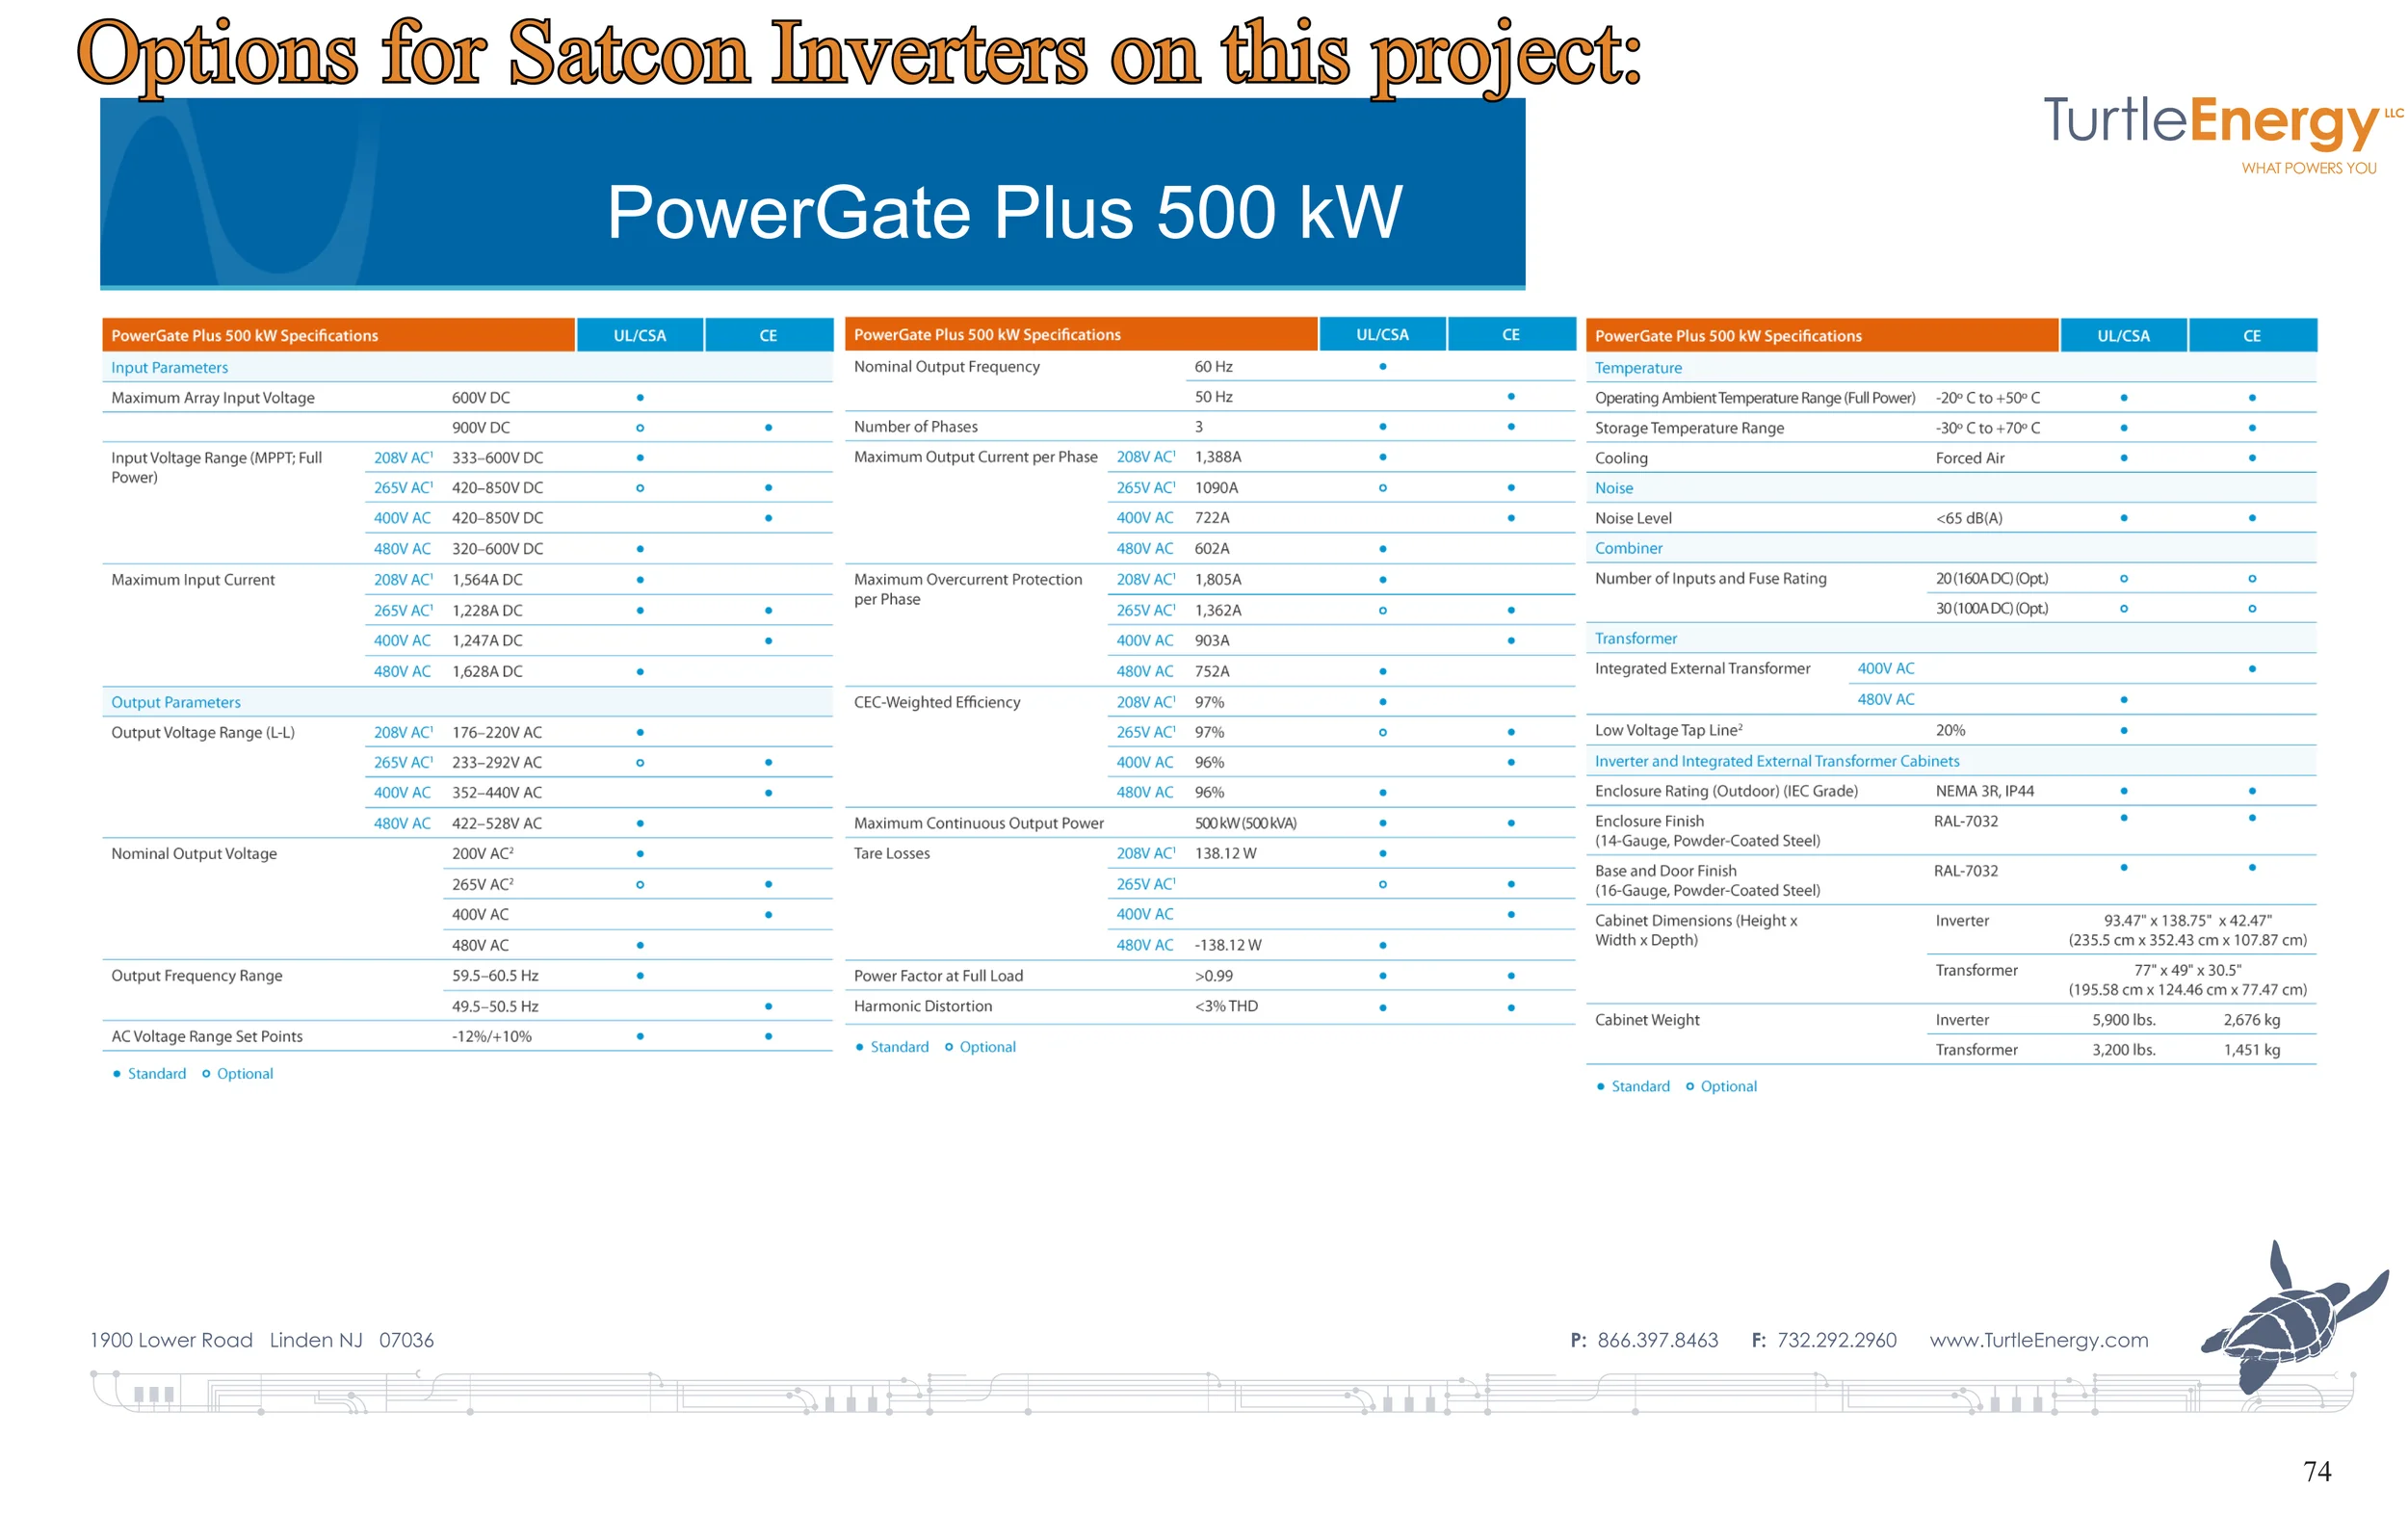
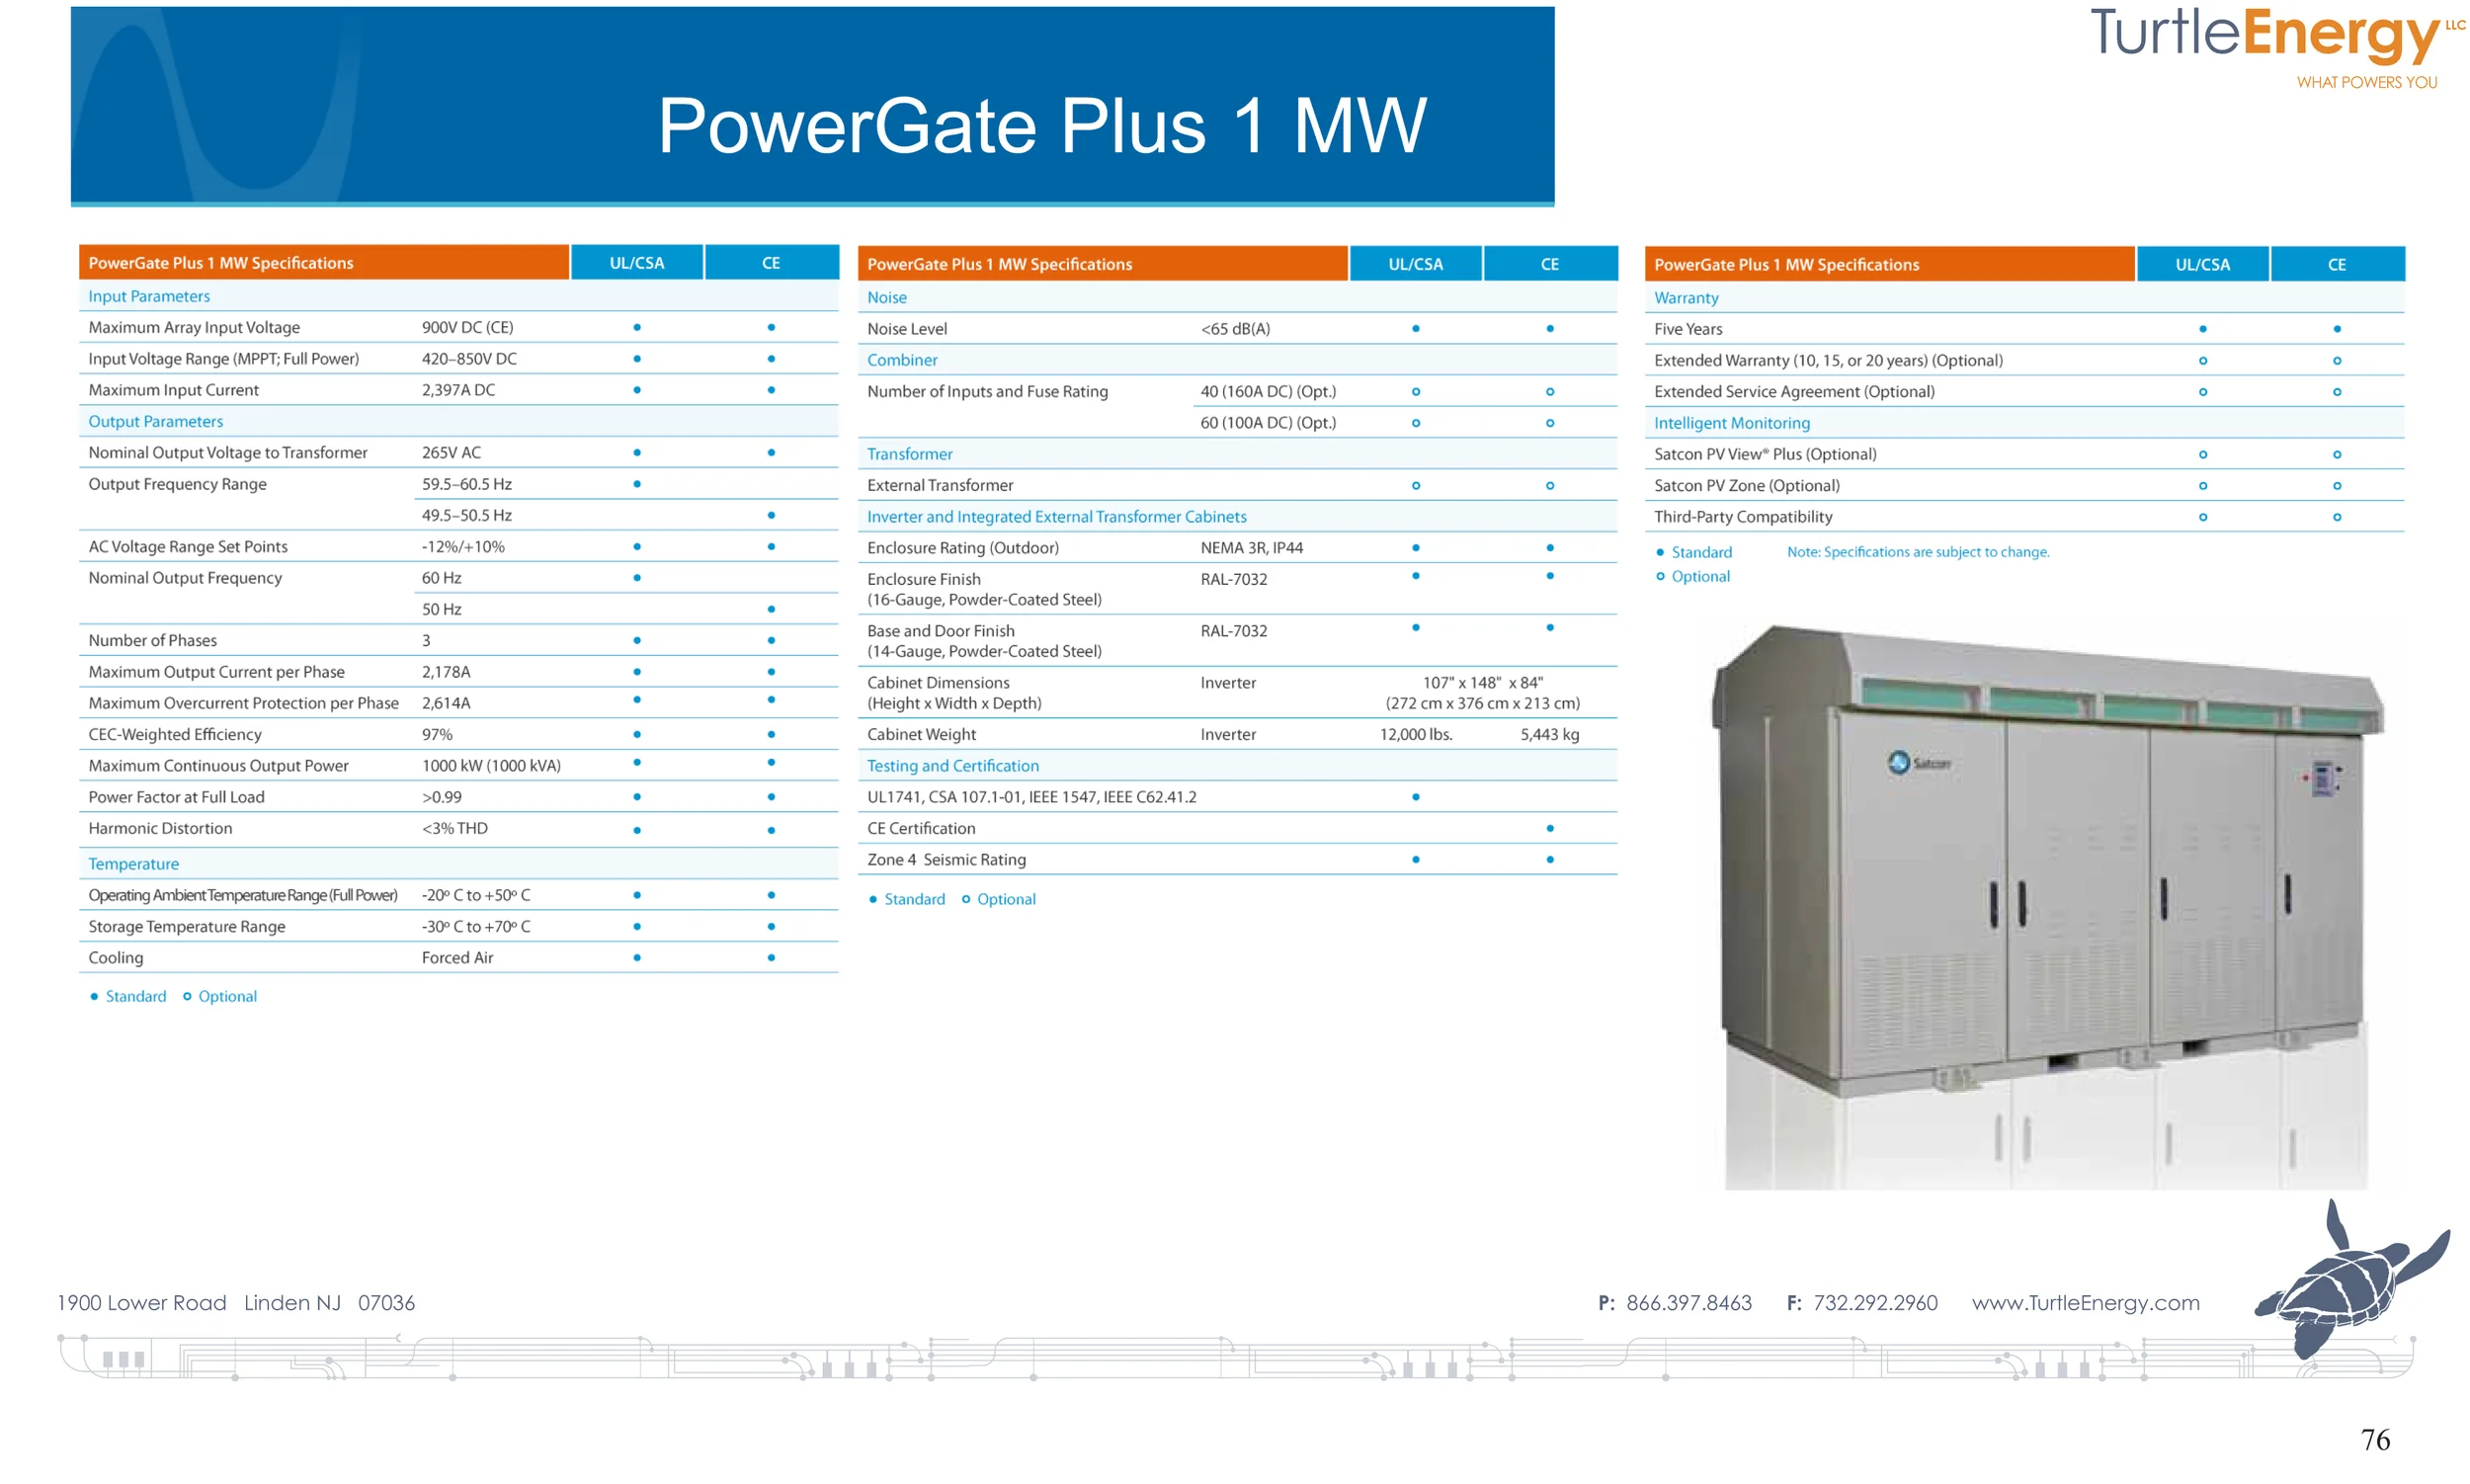
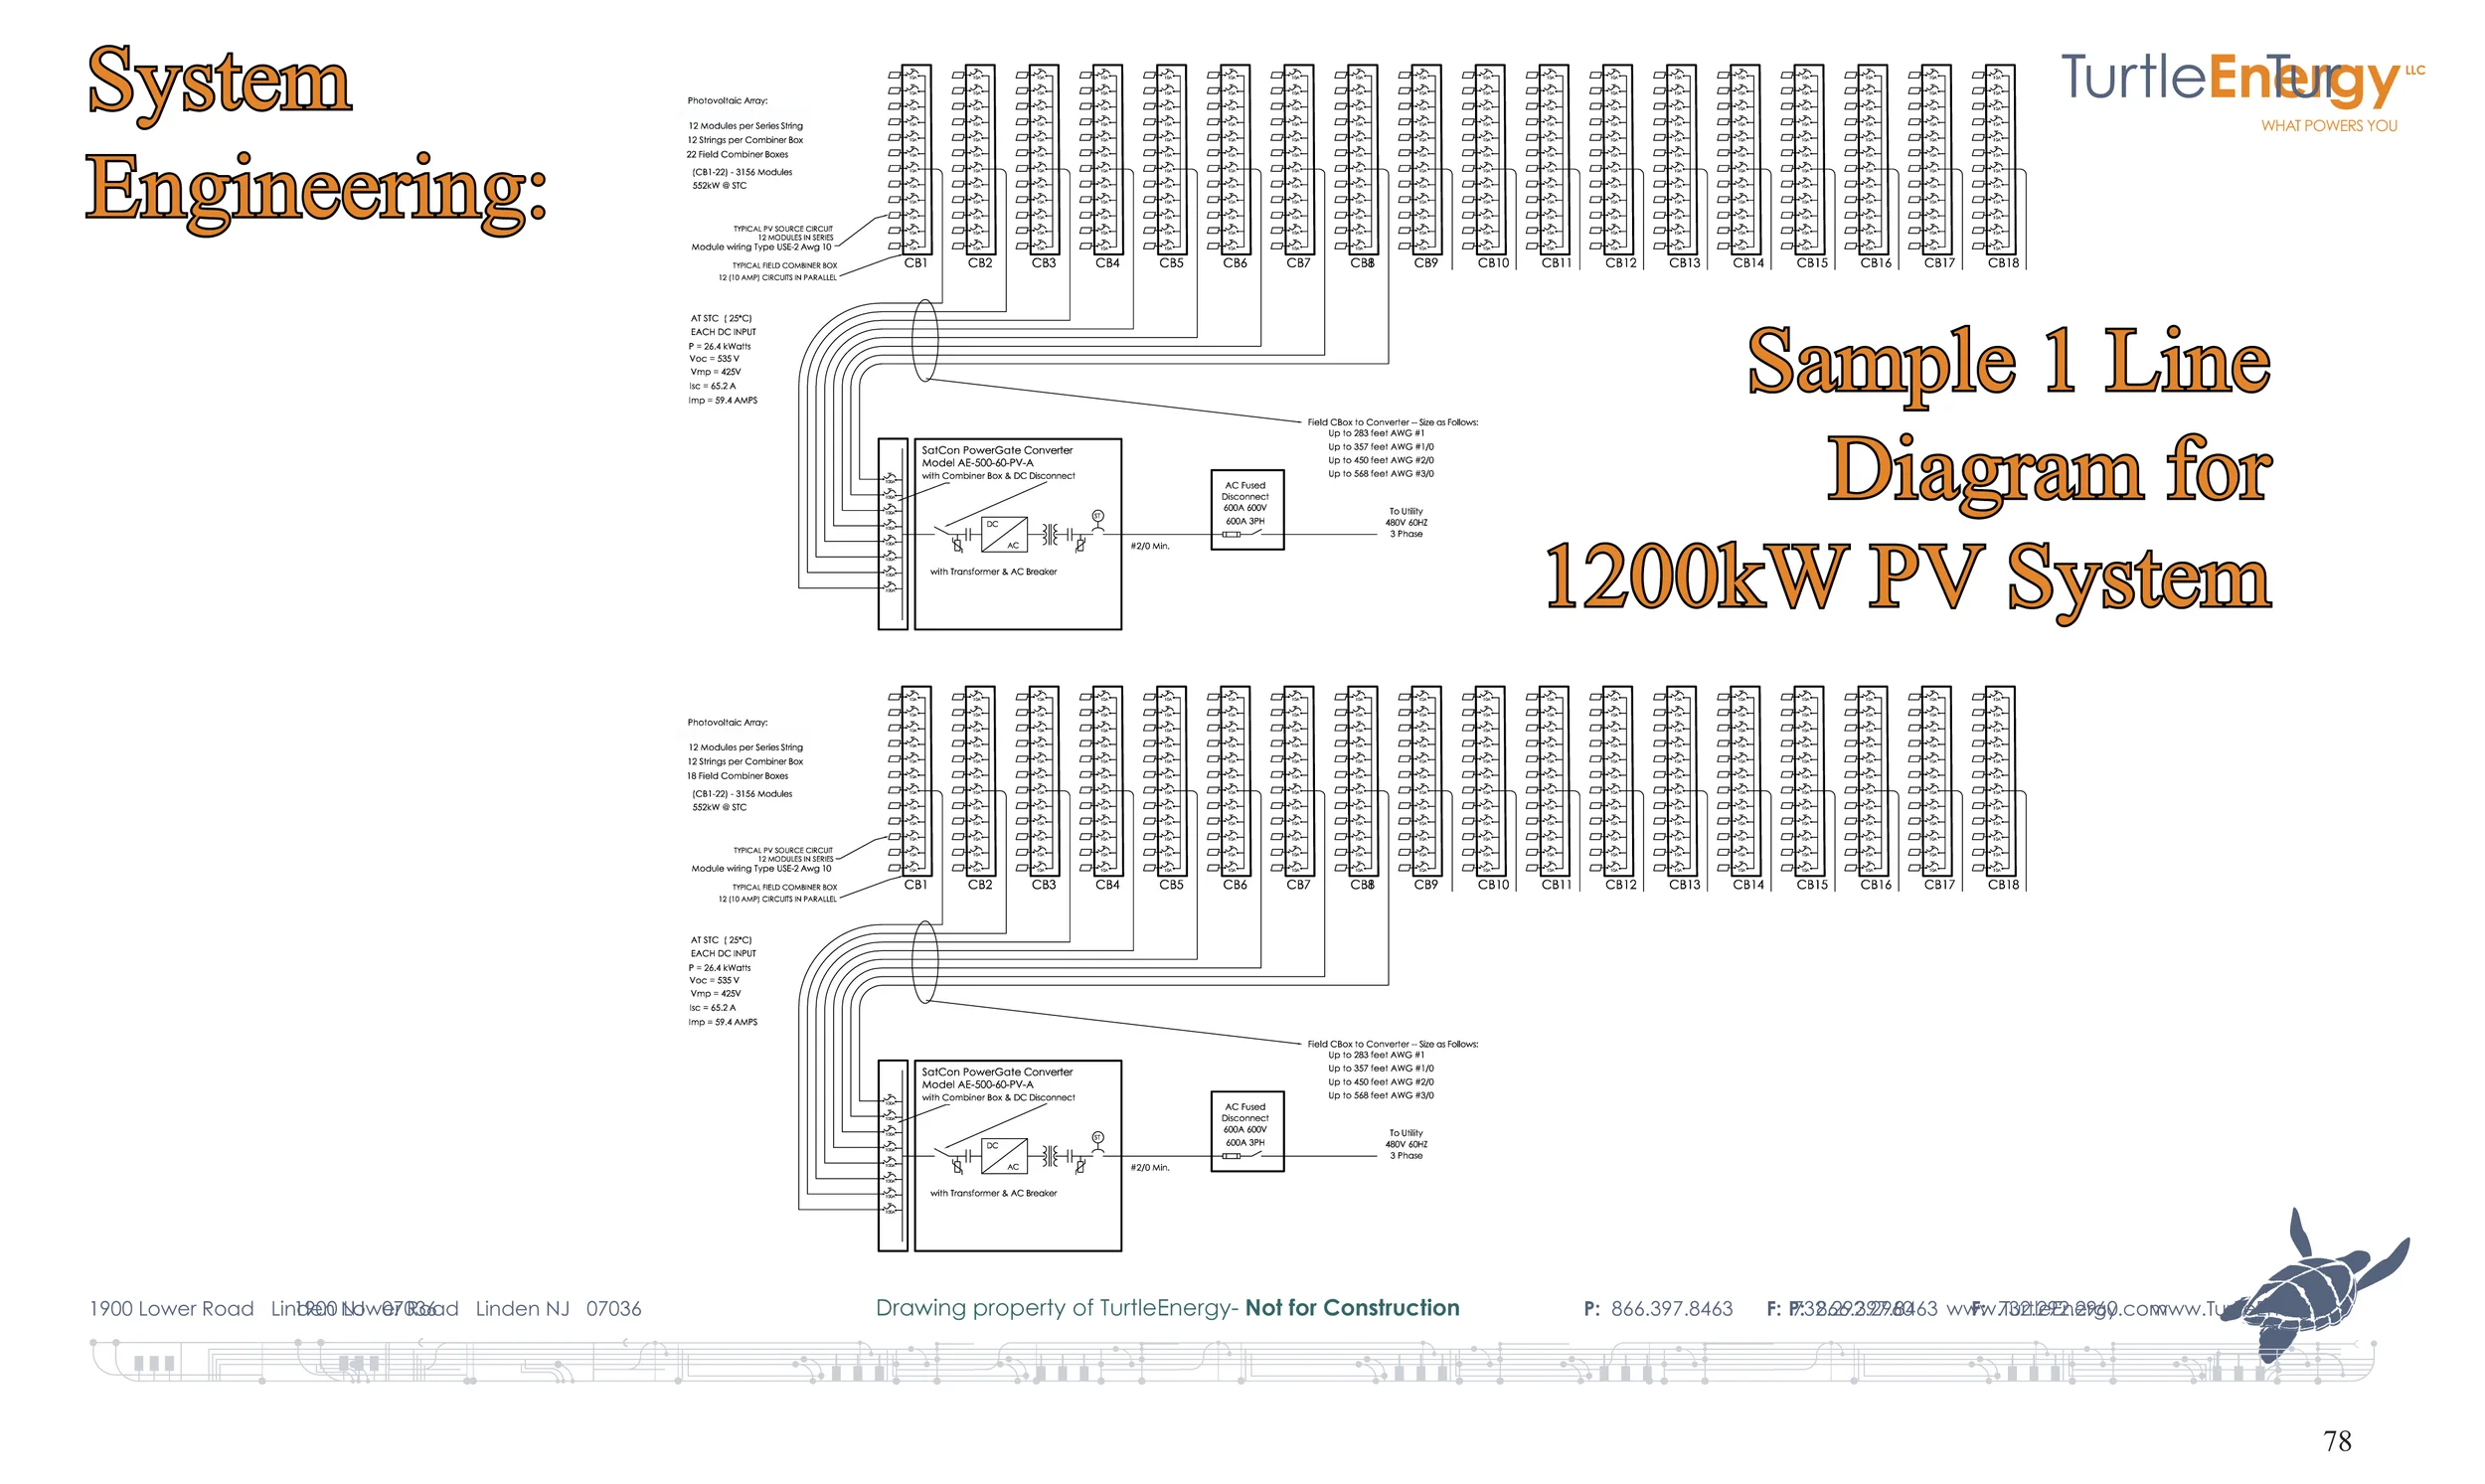
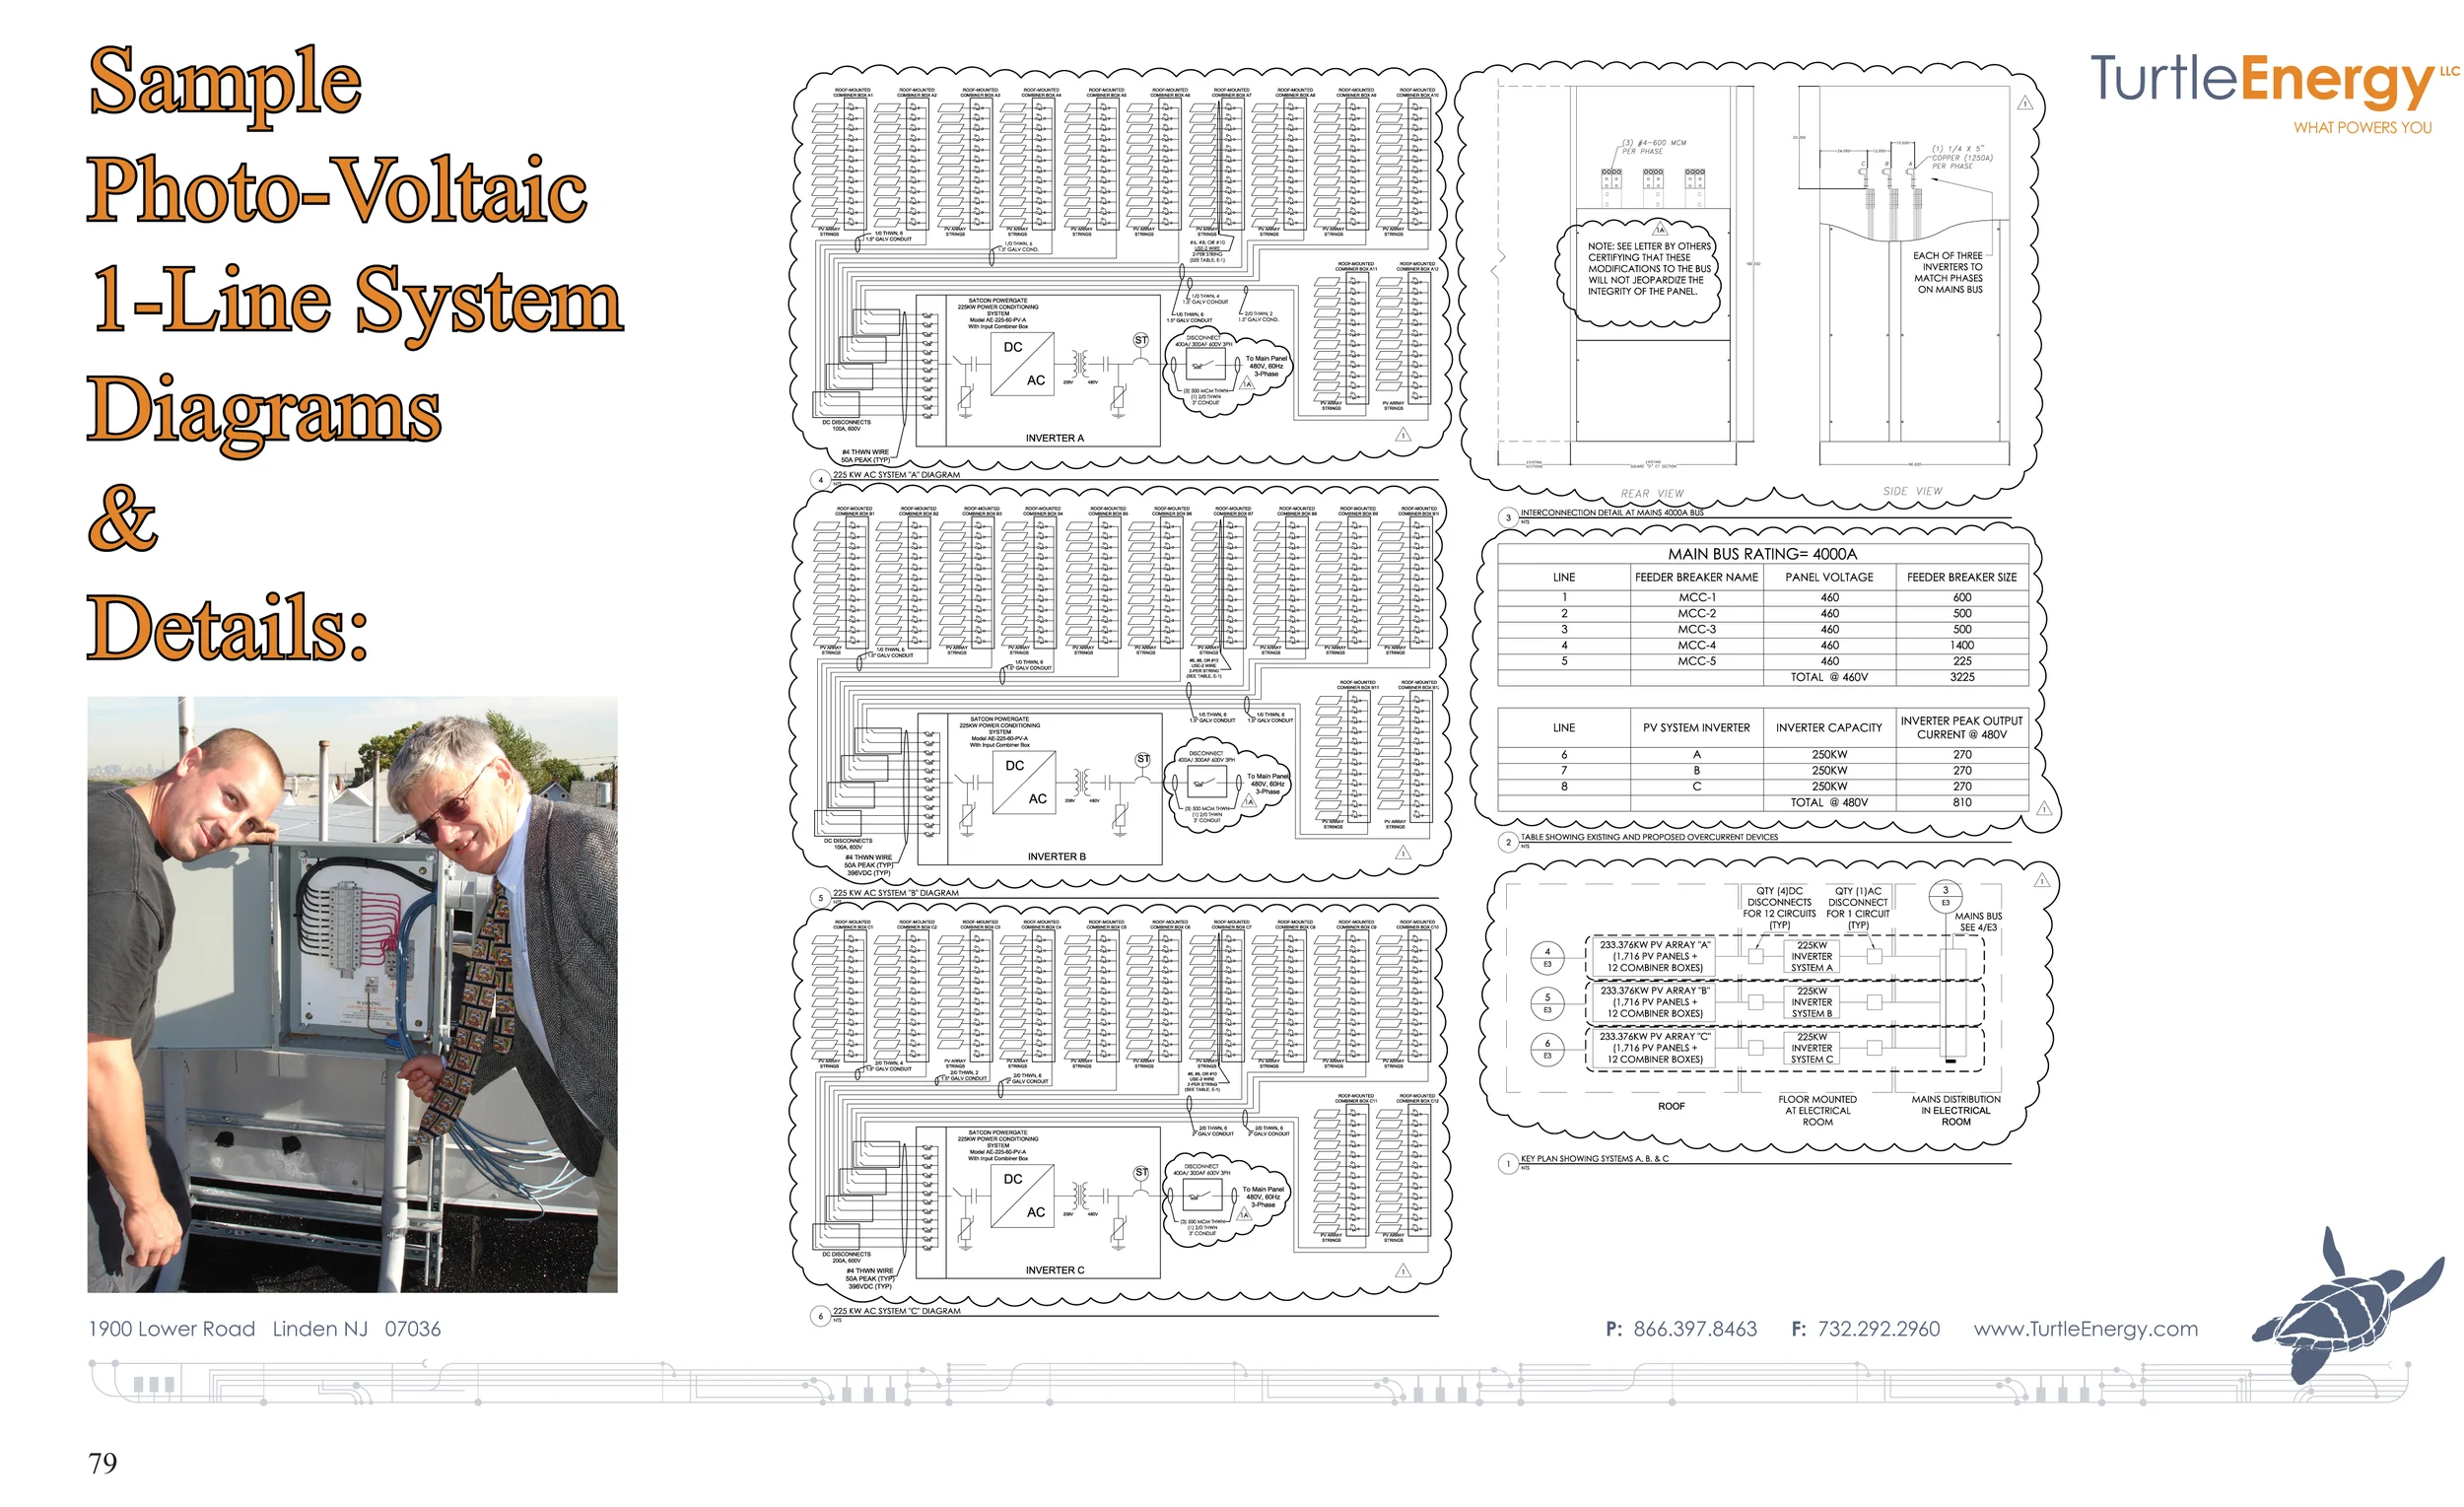
Millard modelled the annual energy production that he forecast for the the project, communicated the intermittent behavior of the system to the utility and complied with the utility goal of constraining the AC output of the system to 5MW. This was accomplished by deploying a single axis tracker from Array Technologies who supplied the project with state of the art mounting hardware. The electrical design of the project, which was sited one half mile from the point of connection, used medium voltage (12.6kV) transformers to step up the native 200V inverter output in order to minimize line losses and to match the voltage that the utility metered power at the site. The school built a new load center for the campus that was coordinated with the solar electrical power requirements prior to the start of the solar project construction.The shovel ready 6MW solar project was then sold to a private power producer who provided the $28M fund to construct the project.
Schematic Design of The Lawrenceville Solar Project:
Millard formed TurtleEnergy in 2003 in response to the growing world demand for alternative energy solutions to a growing shortage of energy. Together with Millard’s architectural experience and a company called Turtle & Hughes, Inc., they became the nation’s first electrical distributor to form a renewable energy system integration, design & supply company. TurtlEnergy, LLC was founded by Millard and has grown sales of renewable energy systems from a $500,000 in 2004 to over $10,000,000 in 2006. Design and Supply of renewable energy systems is an activity which directly relates to the training which Millard received as an architect due to the highly multi-disciplinary nature of structural, mechanical, civil and electrical engineering coordination required in the renewable energy systems integration business. Hence, Millard formed a team of highly skilled architects & engineers with long histories in the renewable energy industry together with operational specialists within Turtle & Hughes. Prior to the Lawrenceville Project, TurtleEnergy had designed, supplied, construction managed and commissioned over forty solar projects in California, Massachusetts, Pennsylvania and New Jersey.
TurtleEnergy was a company created by John Millard in 2003 to design and supply photovoltaic energy systems to be retrofitted onto commercial buildings. This activity took place within the constraints of the New Jersey Clean Energy Program and other state programs. This state program was conceived to create incentives for the construction of clean energy systems to produce electricity for businesses and homes in the state of New Jersey.
The Lawrenceville project with the culmination of eight years of business activity by TurtlEnergy which by then had designed over 30 solar electric systems for customers in California, New Jersey, Massachusetts, Pennsylvania, Connecticut and New York.
On-site generation of electricity by utility customers was a relatively new phenomenon on the East Coast. Most solar electric systems interconnected in New Jersey up until January 2010 we're limited to 2 MW AC by the Board of Public utilities in New Jersey. In February 2010, the Board of Public utilities removed the 2MW maximum system size in New Jersey. This regulatory change occurred in the middle of the process of awarding the Lawrenceville project to TurtlEnergy. The increased size of the system could now achieve 6 MW in order to satisfy the entire annual electricity budget of the Lawrenceville School which was 9,500MWh (or 9,500,000KWh- roughly $1M of electricity per year). Virtually tripling the size of the solar project overnight, The Solar Energy Advancement and Fair Competition Act of 2010 turned our 2MW Solar Project into a 6MW project, an order of magnitude of increased change and economy of scale.
The increased economy of scale by tripling the size of the project not only reduced the unit cost of the project, but also enabled the sale price of electricity to Lawrenceville to be reduced by 40%. The cost of solar panels was still relatively high (compared to 2013 prices) but inverter costs reduced, installation prices reduced, and balance of system prices reduced (wire, mounting hardware, switches, tray, enclosures and other non-Pv components).
The reduction of these costs also helped to consolidate the preferred design option- a single axis tracker mounted PV system which rotated with the altitude of the sun over the course of the day (as opposed to the fixed tilt stationary mount that cost less).
Schematic Design Issue: Mounting Hardware Selection
There are a number of advantages to the single-axis tracker despite its 5% increased cost to the overall project. Convincing others of this benefit, when they have concerns over the addition of moving parts to the mounting hardware is a challenge. This debate with parent company senior management was topical at the beginning of the project. Essentially, in order to produce the equivalent annual energy of a single axis tracker, one must purchase 15% more solar modules, inverters, mounting hardware and balance of systems to do so. This expenditure alone might silence a critic of moving parts, but there's more- that fixed tilt system redundancy costs to pay for. That 15% larger rated fixed tilt system is going to produce far less electricity in the morning and late afternoon because of its azimuth angle facing due south. Since the fixed, south facing system makes up for this disadvantage at noon, by producing exponentially more power for an hour or two to make up for its poor morning and afternoon performance. This reality is overlooked when designing smaller systems because of the huge premium that a tracker adds to a small system such as a residential size. This spike of power at noon is accommodated by the utility with smaller systems, but not with Multi MW systems. The utility in the case of the Lawrenceville Project required a 5MW AC cap to the load profile of our design, largely due to the size of the utility wire that served the site. The larger, noon spike of the fixed tilt Pv system resulted in over 150 hours of +5MW operation that would have to be "clipped" or limited using current limitation devices at the point of common coupling in the newly constructed electrical building on the campus. The amount of electricity lost as a result of this clipping was significant enough to diminish any perceived advantage of using a fixed tilt system and the tracker was adopted at schematic design stage of the project. The failure mode analysis of the tracker's moving parts was peer reviewed by Black & Veatch and validated by those venerated engineers as investment grade. Our lender's due diligence engineer, Lahmeyer International also concurred that the tracker made by Array Technologies was "bankable" and the drive motor manufactured by Bonfigliotti was vastly under-employed in the tracker application. Turning the torque tube of mounted modules by one half of one degree every three minutes when it was designed to rotate many hundreds of RPM it seemed to them to be well within the specification of the motor. The slew ring that transferred this tiny rotation into the torque tubes of each module row did have a defective seal in early shipments to early projects in 2006, but this was a quality control problem in the Chinese assembly. All assembly is now in house at Array Technologies in Albuquerque. A site visit to the HQ prior to the $3M purchase of the 6MW tracker proved out the quality.
Schematic Design Issue: Unforeseen Geotechnical Cost Mitigation:
Regardless of the tracker vs. fixed tilt mount, each of these systems were vulnerable to unforeseen geotechnical risks due to the base case cost assumption that these structures would find favorable ground conditions and the steel posts would be driven freely into the ground using a vibratory pier driver. This method of pier placement requires no concrete and relies on eight to twelve feet of penetration in order to support the lateral load of the wind driven module surface area. If the ground is a "hard dig" situation, it can drastically increase the mounting hardware cost compared to a self-ballasted solution such as Game Change's cast in place system. Our geotechnical study indicated a 20% chance of "pier refusals" which meant that additional equipment and/or concrete footings would be required to solve for the structural spec on each refusal. A pilot hole can be a lowest additional cost, where a drilling rig comes in behind the vibratory pile driver and reems the pier hole to depth and performs a pull out test or, if rocky condition prevail such that a pilot hole is insufficient for the task, then shallow concrete foundations may be the only solution. This is the worst case scenario and can add $100 to $200 per pier. These are the true risks of ground mounted solar, not the moving parts of a single axis tracker.
Another challenge specific to the single axis tracker is the mid-module mount onto the 4" torque tube. This mount can result in bending the module around the midpoint and cause micro-cracking in the 150 micron thick silicon cells if heavy snowfall settles on the tracked modules while in stow (horizontal) position. Fortunately, thanks to the fact that the range of movement rotates the module every day over 90 degrees, it is impossible for snow to accumulate over more than a 12 hour period. Should 30psf accumulate during that 12 hours during the stowage overnight in horizontal position, then the bracketry that attaches the module to the torque tube must clamp at least 24" of the mid section of the module if the warranty on the module is to be preserved. Most module manufacturers archive an electro-fluoroscopic image of every module that they encapsulate and use this "x-ray" image as proof that the module had no cracks in the cells at shipment. In the case of the Lawrenceville Solar Project, 25,000 solar modules mid-mounted on torque tubes were sufficient cause to request a special project specific written warranty for re-assurance. This the module manufacturer did, and provided it with accompanying failure mode testing documentation of the solar module. The deflection of the module, and the resulting documented micro cracks were clearly defined so that tolerances were understood and engineered for in advance of installing the 6MW project.
Schematic Design Issue: Which is the greater risk? Electrical Risk or Mechanical Risk?
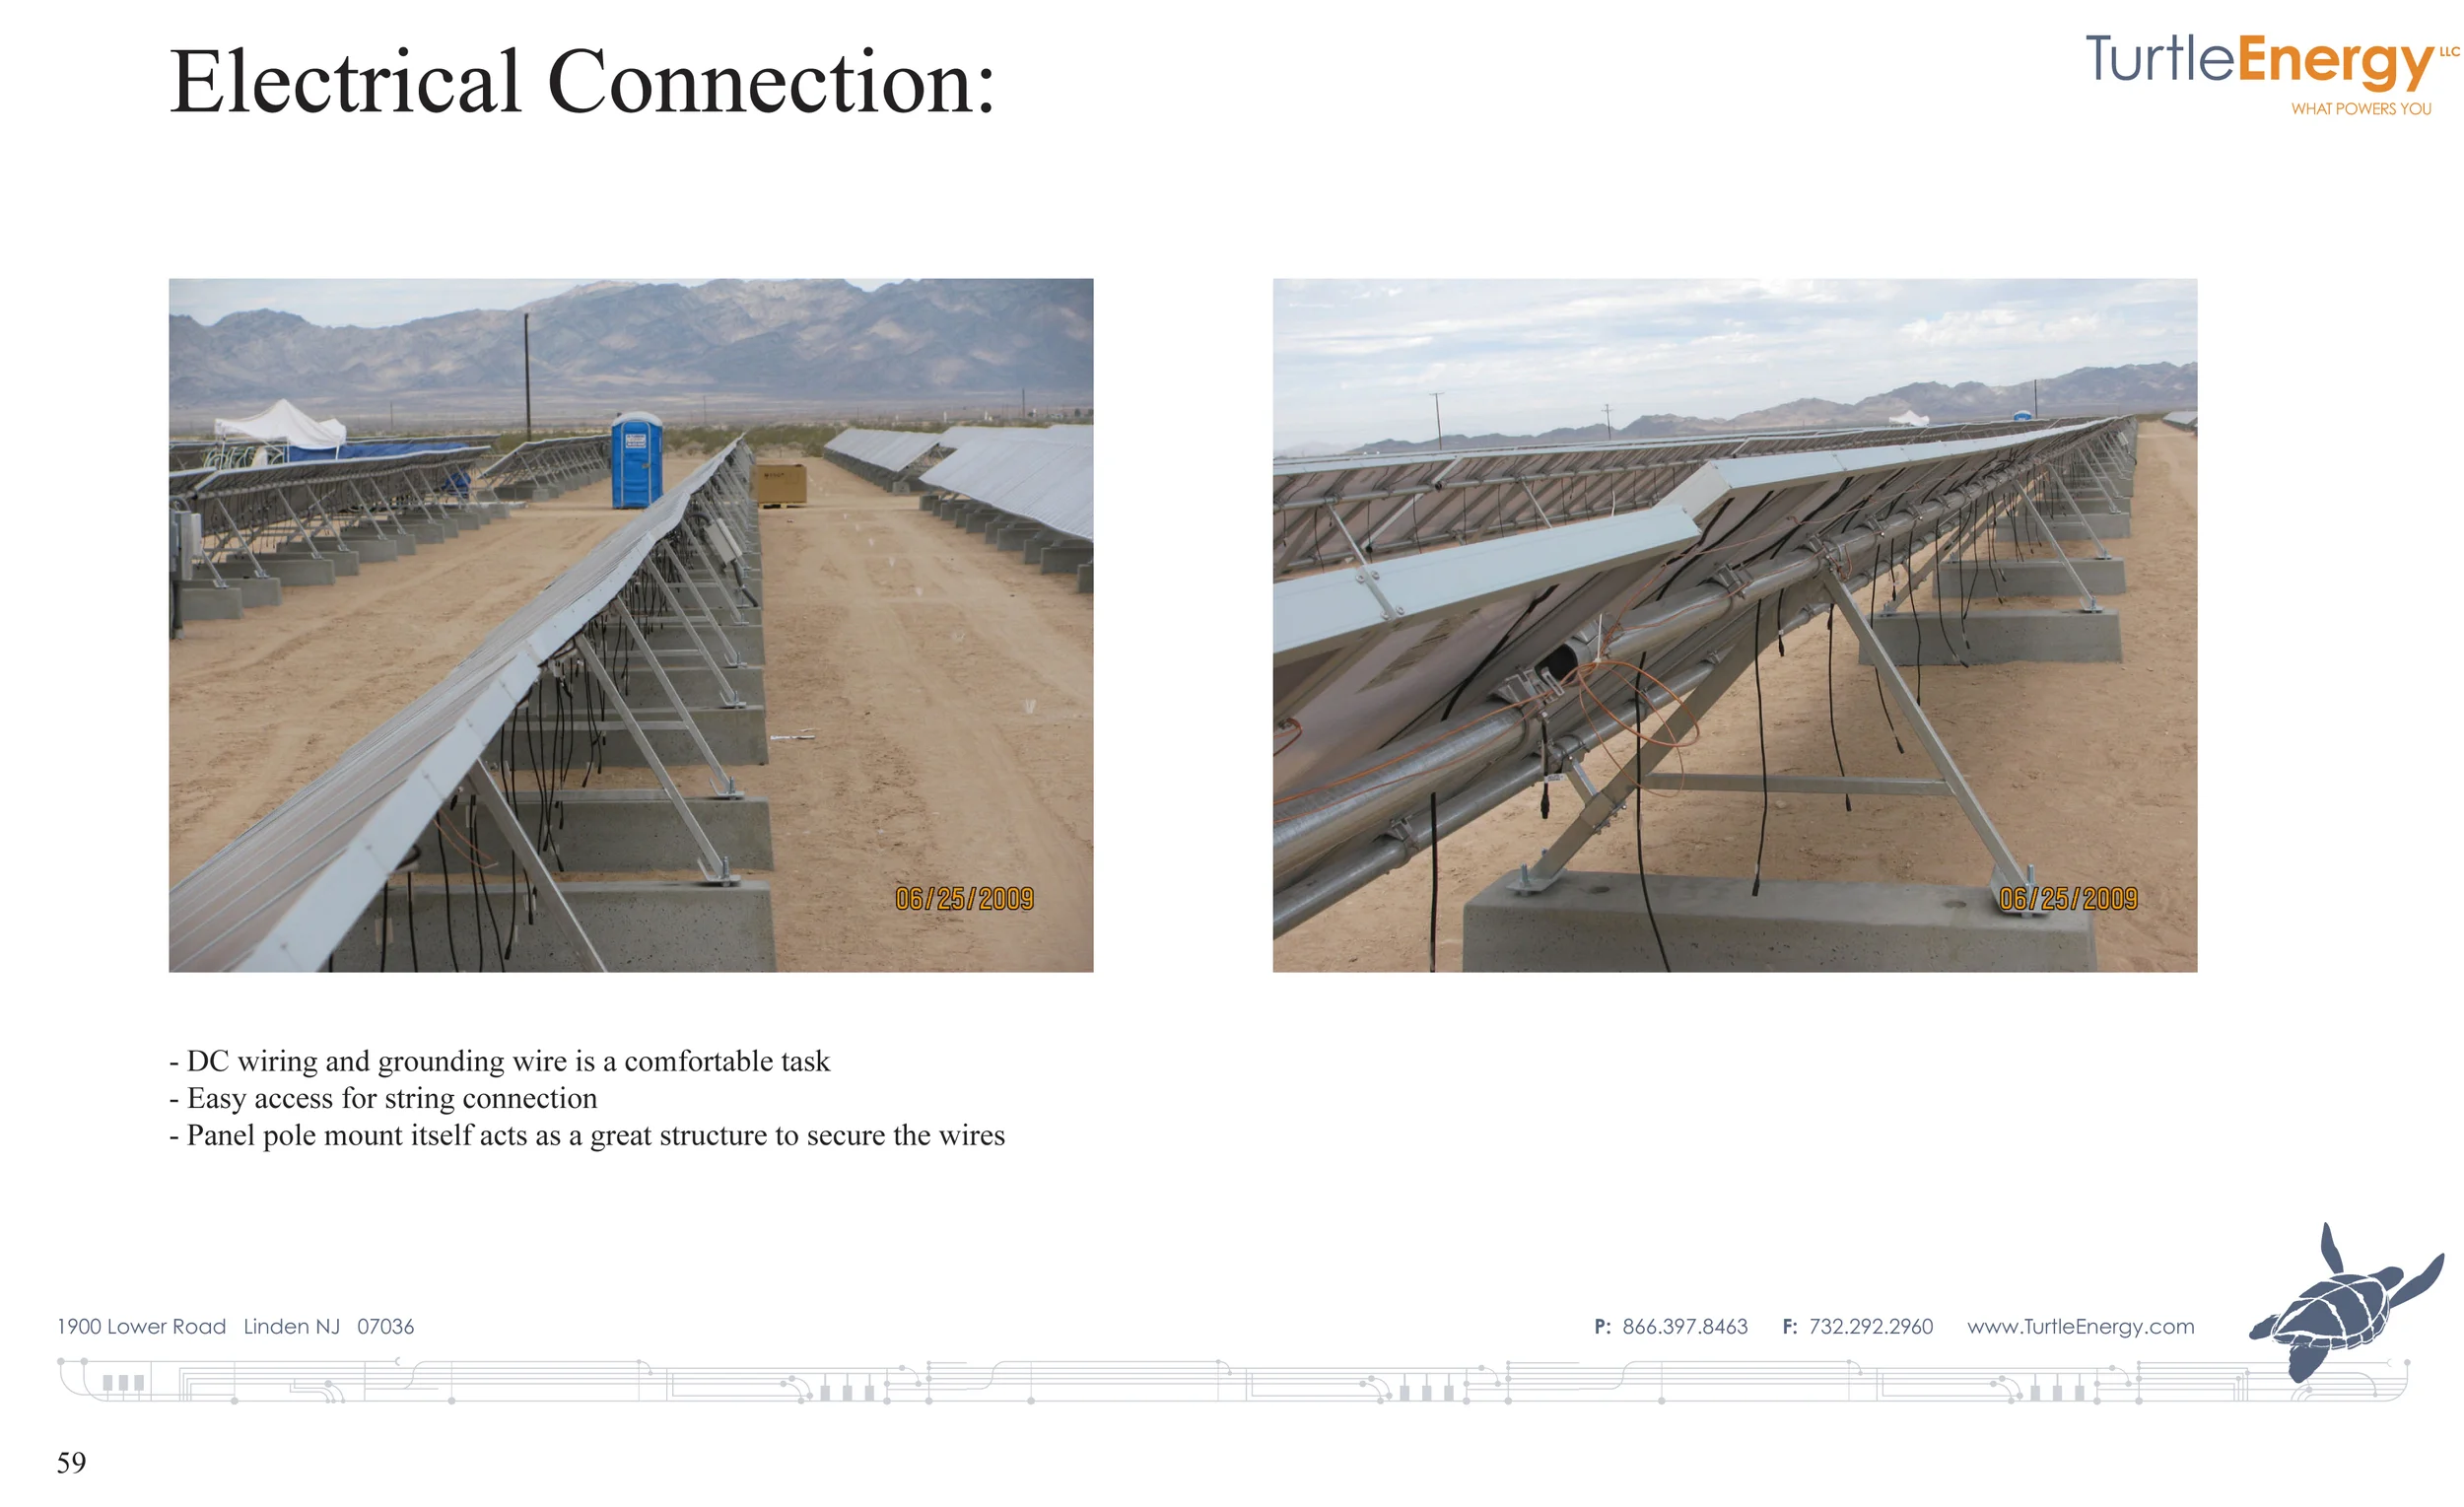
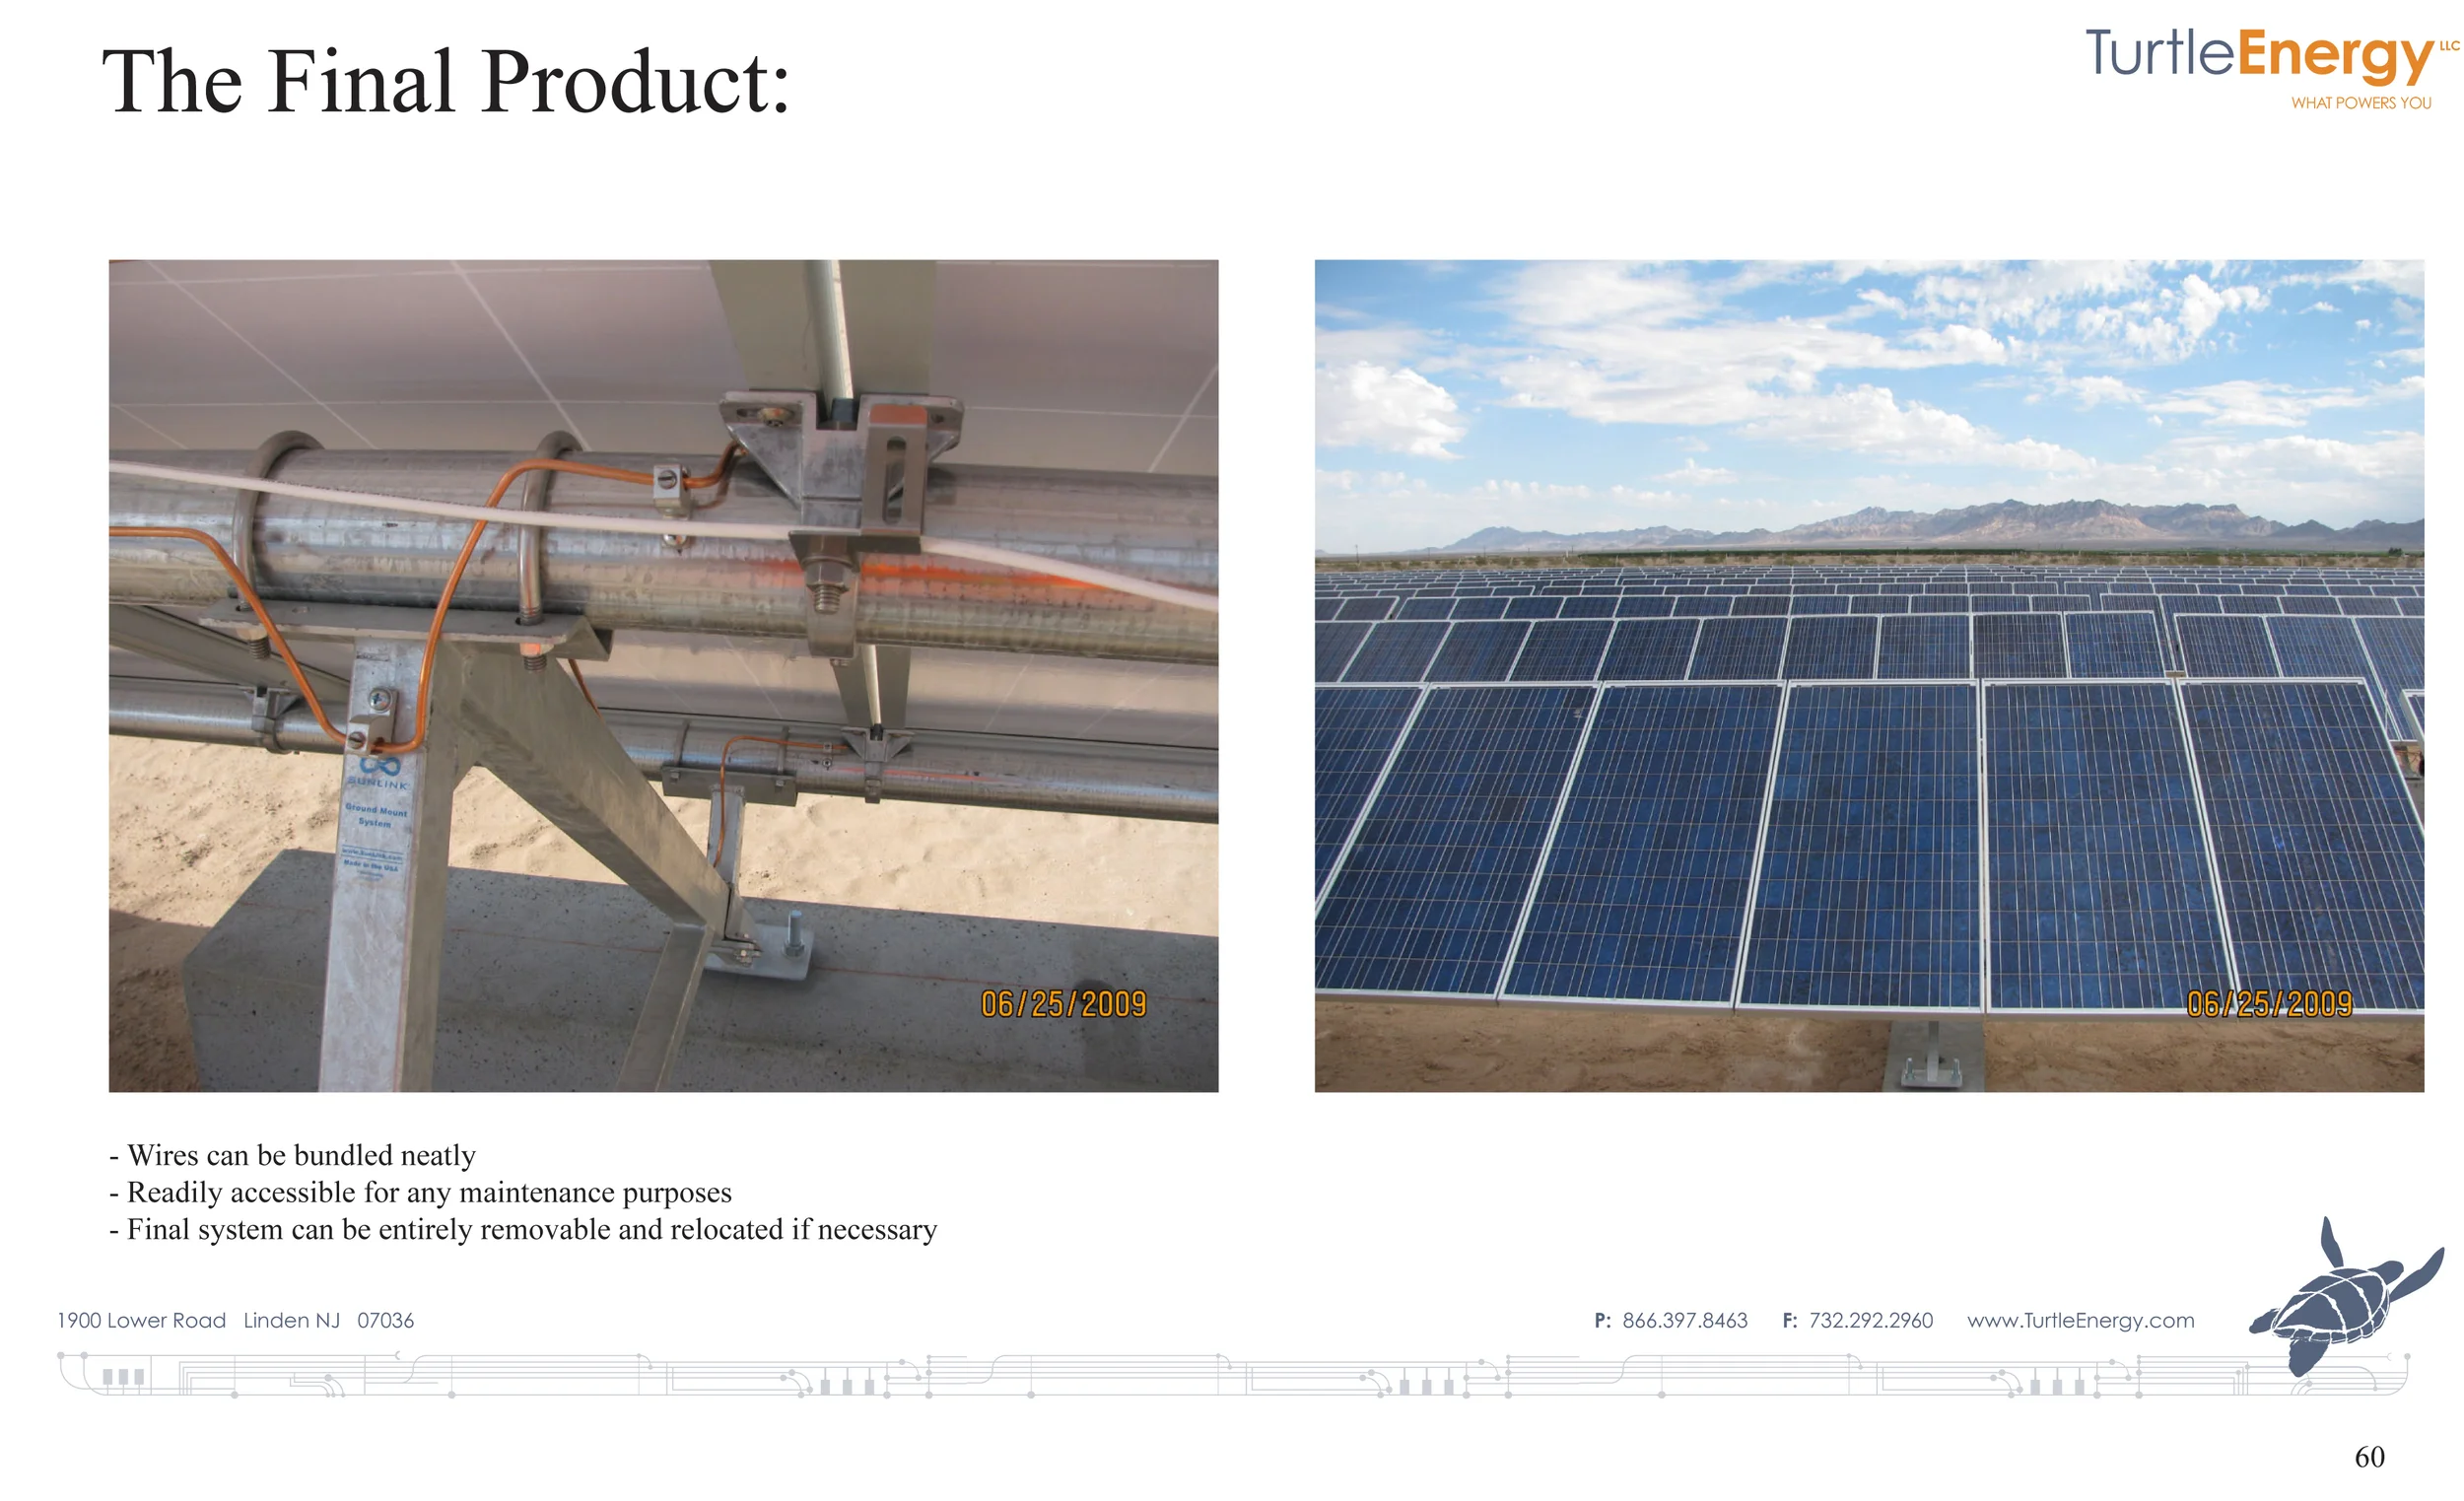
The mechanical opportunities for disaster on a large ground mount are by far more risk than the electrical risks, especially since National Electrical code section for PV has been so thoroughly forged. There have been ground mounted projects that were seamlessly designed and installed but for the near constant 30mph winds year round that induced a harmonic vibration akin to the "galloping girdie" effect that destroyed the Tacoma Narrows Bridge. The tracker manufacturer at Array Technologies had this mechanical risk in mind when he designed into the ends of each module row a hydraulic damper to quash any such movement that might emerge. The rest of the hardware involved with mounting the modules, the module clamps, the viscous couplings that capture the torque tubes, the slew rings, the drive assembly with the universal joints that enable a high degree of tolerance for unruly topography and other components are all well travelled designs from the automotive industry that have generations of predecessors. Even the mechanical component of trenching pipe & wire represents more risk than the electrical nature of the wire itself. Trenching electrical cable from a to b is an irresistible mode of operation for most electrical contractors but in practice, it causes nearly as much congestion and "hard dig" risk in practice and is labor intensive- pure profit for an EC and theoretically easy to estimate cost. Most Electrical Contractors do not automatically opt for cable trays as a substitute for trenching cable. In fact, ground mounted solar power projects are a natural application for cable tray. The long runs of mounting structures are easily suited to suspend tray from piers. Electrical contractors frequently trench right next to the arrays of peers that have been driven into the ground- only to be destabilized buy a 24 inch wide trench being cut inches away from the point where they were driven into the ground. Compaction of these trenches never matches the compaction that existed for that pier prior to a trench being excavated immediately next to it. Additionally, soil conservation districts are now requiring topsoil to be removed if extensive trenching is determined to be necessary for a given solar project in New Jersey. 6 to 12 inches of topsoil to be scraped off the surface of the ground and stockpiled on site- silt fences and dust control measures have to be implemented by the contractor. Electrical contractors doggedly carry trenching as their primary distribution strategy for large ground mounted solar projects. At the Lawrenceville solar project, total energy specified cable trays to be clamped to the peers which for the linkage columns. These are the columns that have the driveshaft and the slew rings mounted on top. These are larger eight inch columns compared to the 4 inch piers that support the torque tubes of the solar panels. By mounting the cable tray to these columns, the vast majority of cable on the project can be transported above ground without having to excavate 36 inch deep trenches. Cable Tray, in lieu of trenches liberates movement of construction operatives across the site, unhindered by the hazard of open trenches, not to mention the impediment that erosion and mud can cause long term on any construction site. It was shocking to see how little knowledge there was of cable tray code within the electrical engineering discipline at the consultant level. When the owner expressed a preference for cable tray (because of the farmland that was going to be cycled out of production for the 20 year term of the power purchase agreement) our electrical engineer expressed that it would cost $1M to use tray comprehensively across the project (actually the material cost for the tray was $70k). The labor to install cable tray is less than the labor and equipment to excavate trenches (excluding topsoil stockpiling). Then there are all of the other benefits of cable tray- easy maintenance/ commissioning access, less copper per code, less cable, less loose dirt/ mud, and less disruption to free movement on site.
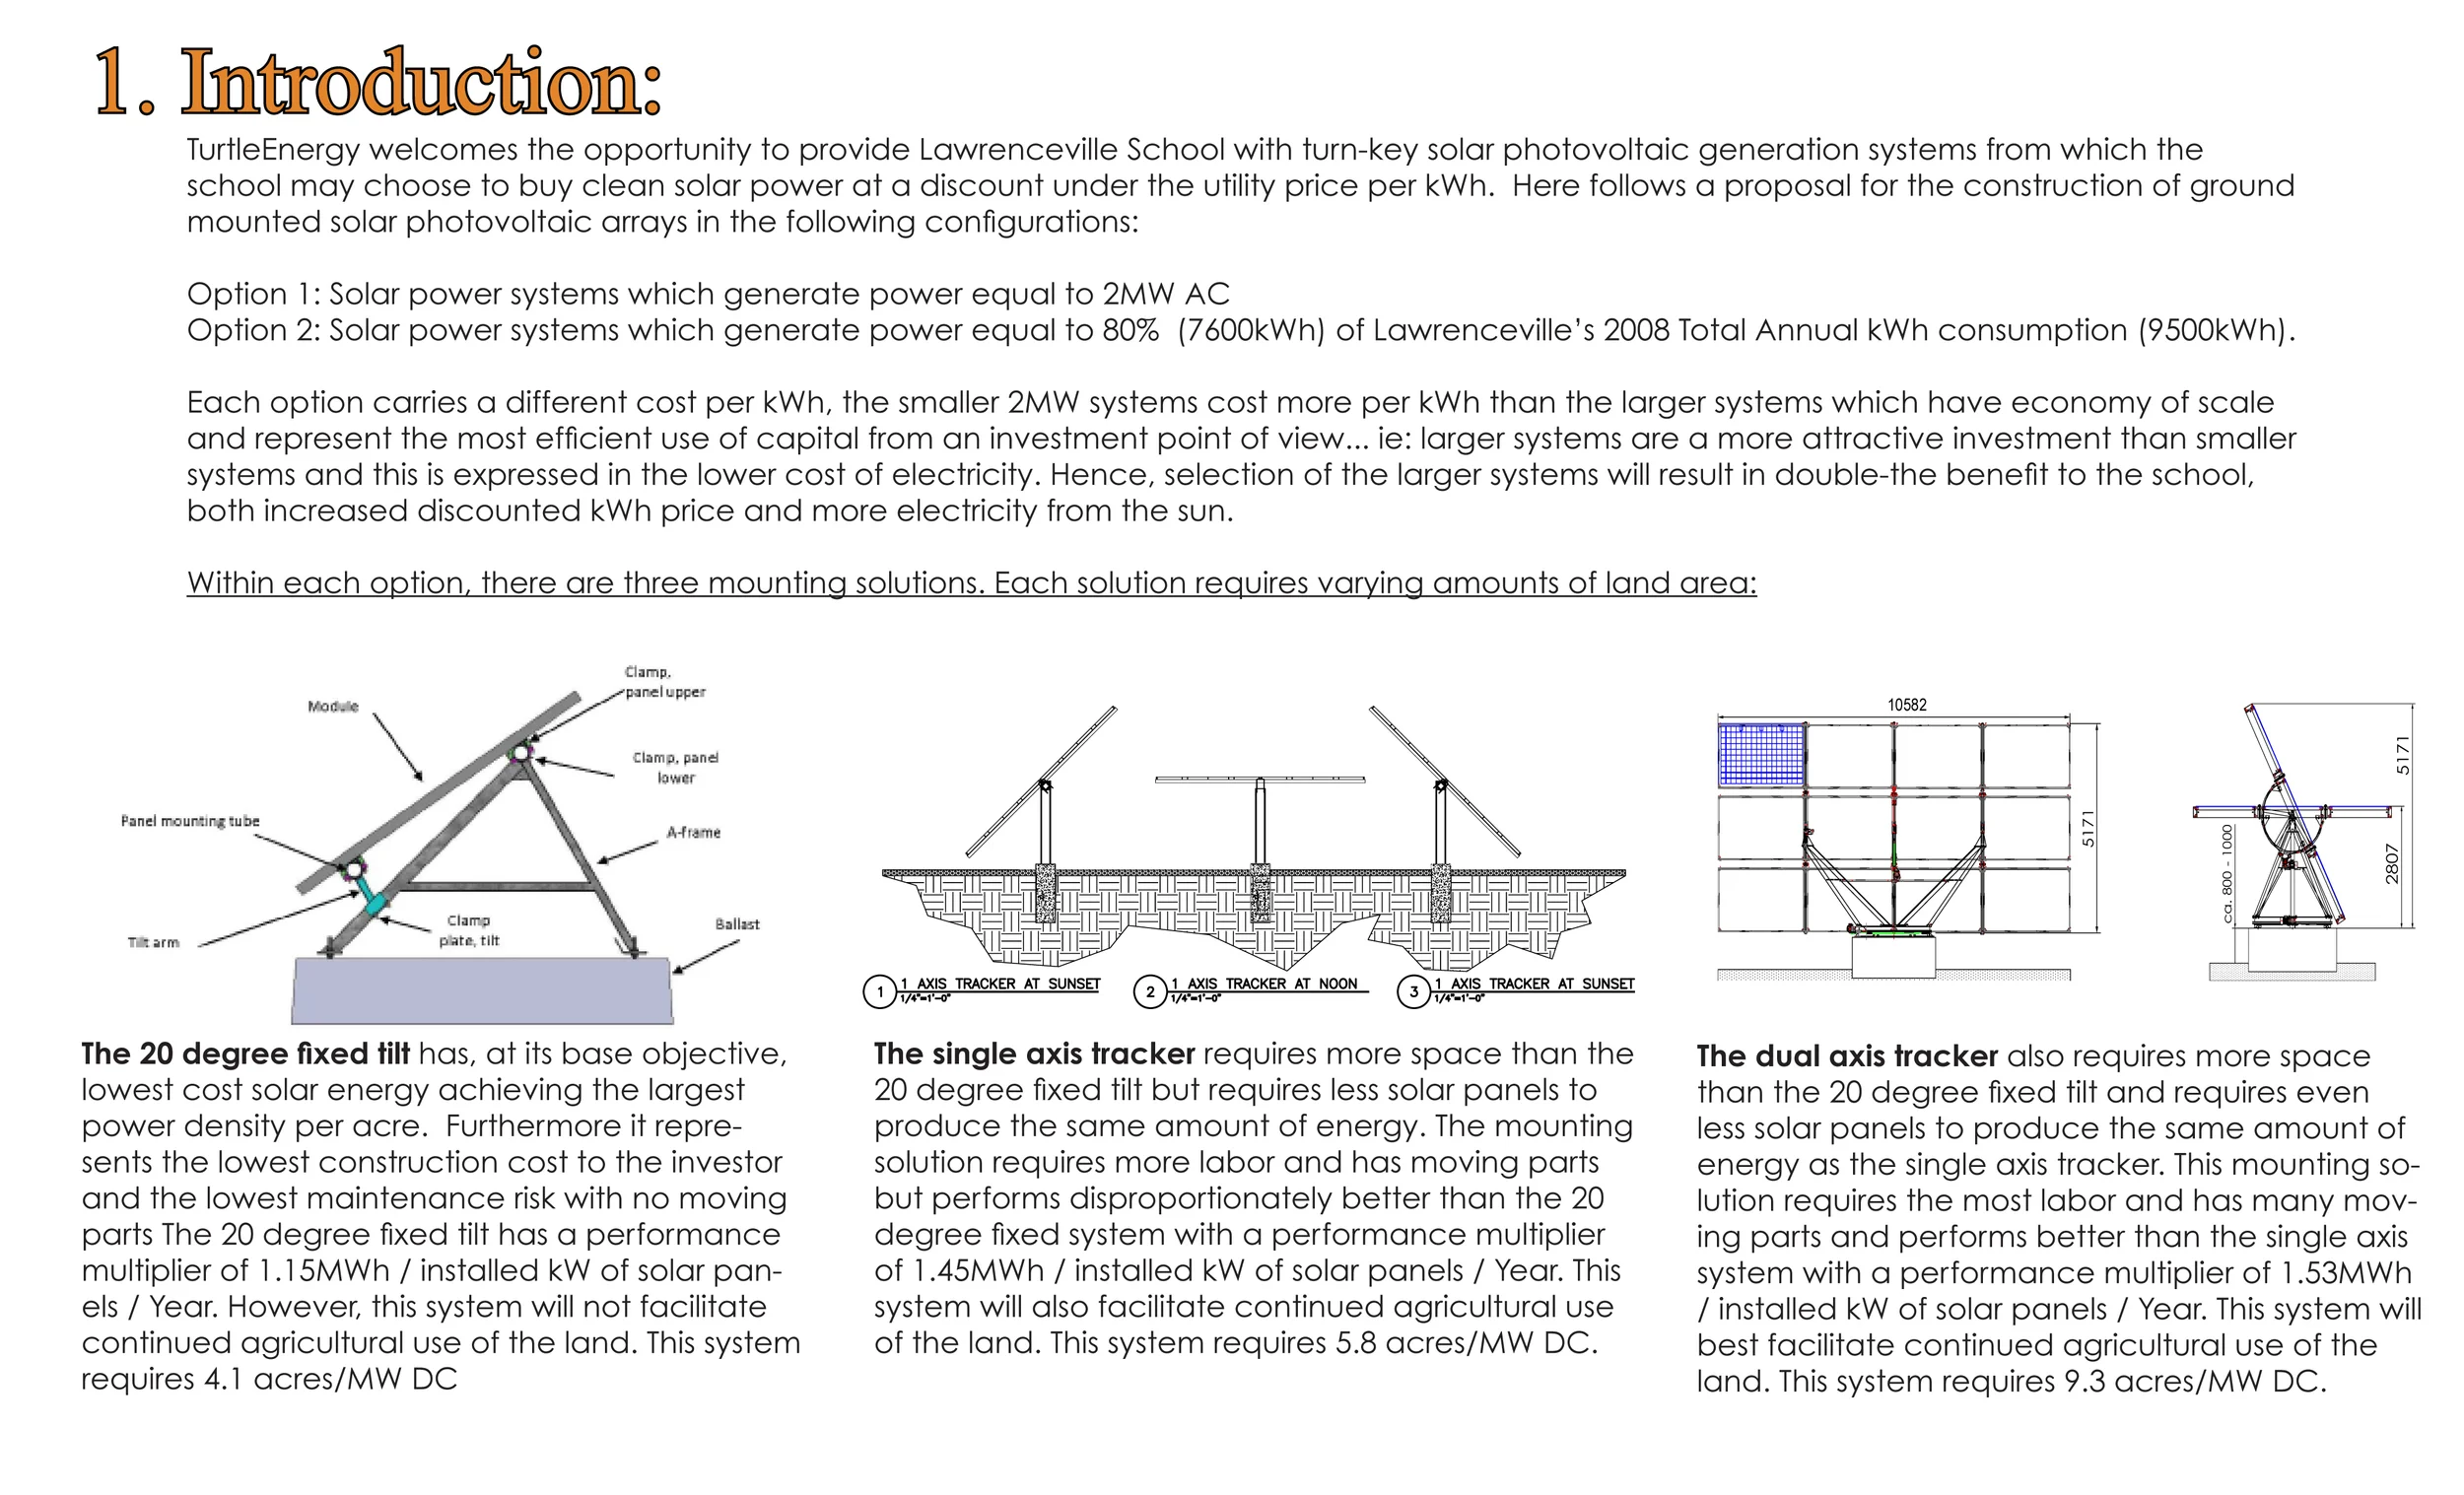
Figure 1: Proposal Introduction explaining the three options that are contained in the Lawrenceville Solar Proposal. Typically, the proposal process id an "education" to landowners.
The three options on this introductory page summarize the different methods that are used to mount solar panels. These options occupy varying amounts of land area, cost varying amounts of money and produce varying amounts of electricity. There are also aesthetic considerations for zoning and each option has it's own merits. This proposal represents a "schematic phase" of design in itself given that the sale of electricity to the consumer of electricity is the "product" of the proposal and not necessarily the solar energy system hardware in this proposal for a power purchase agreement.
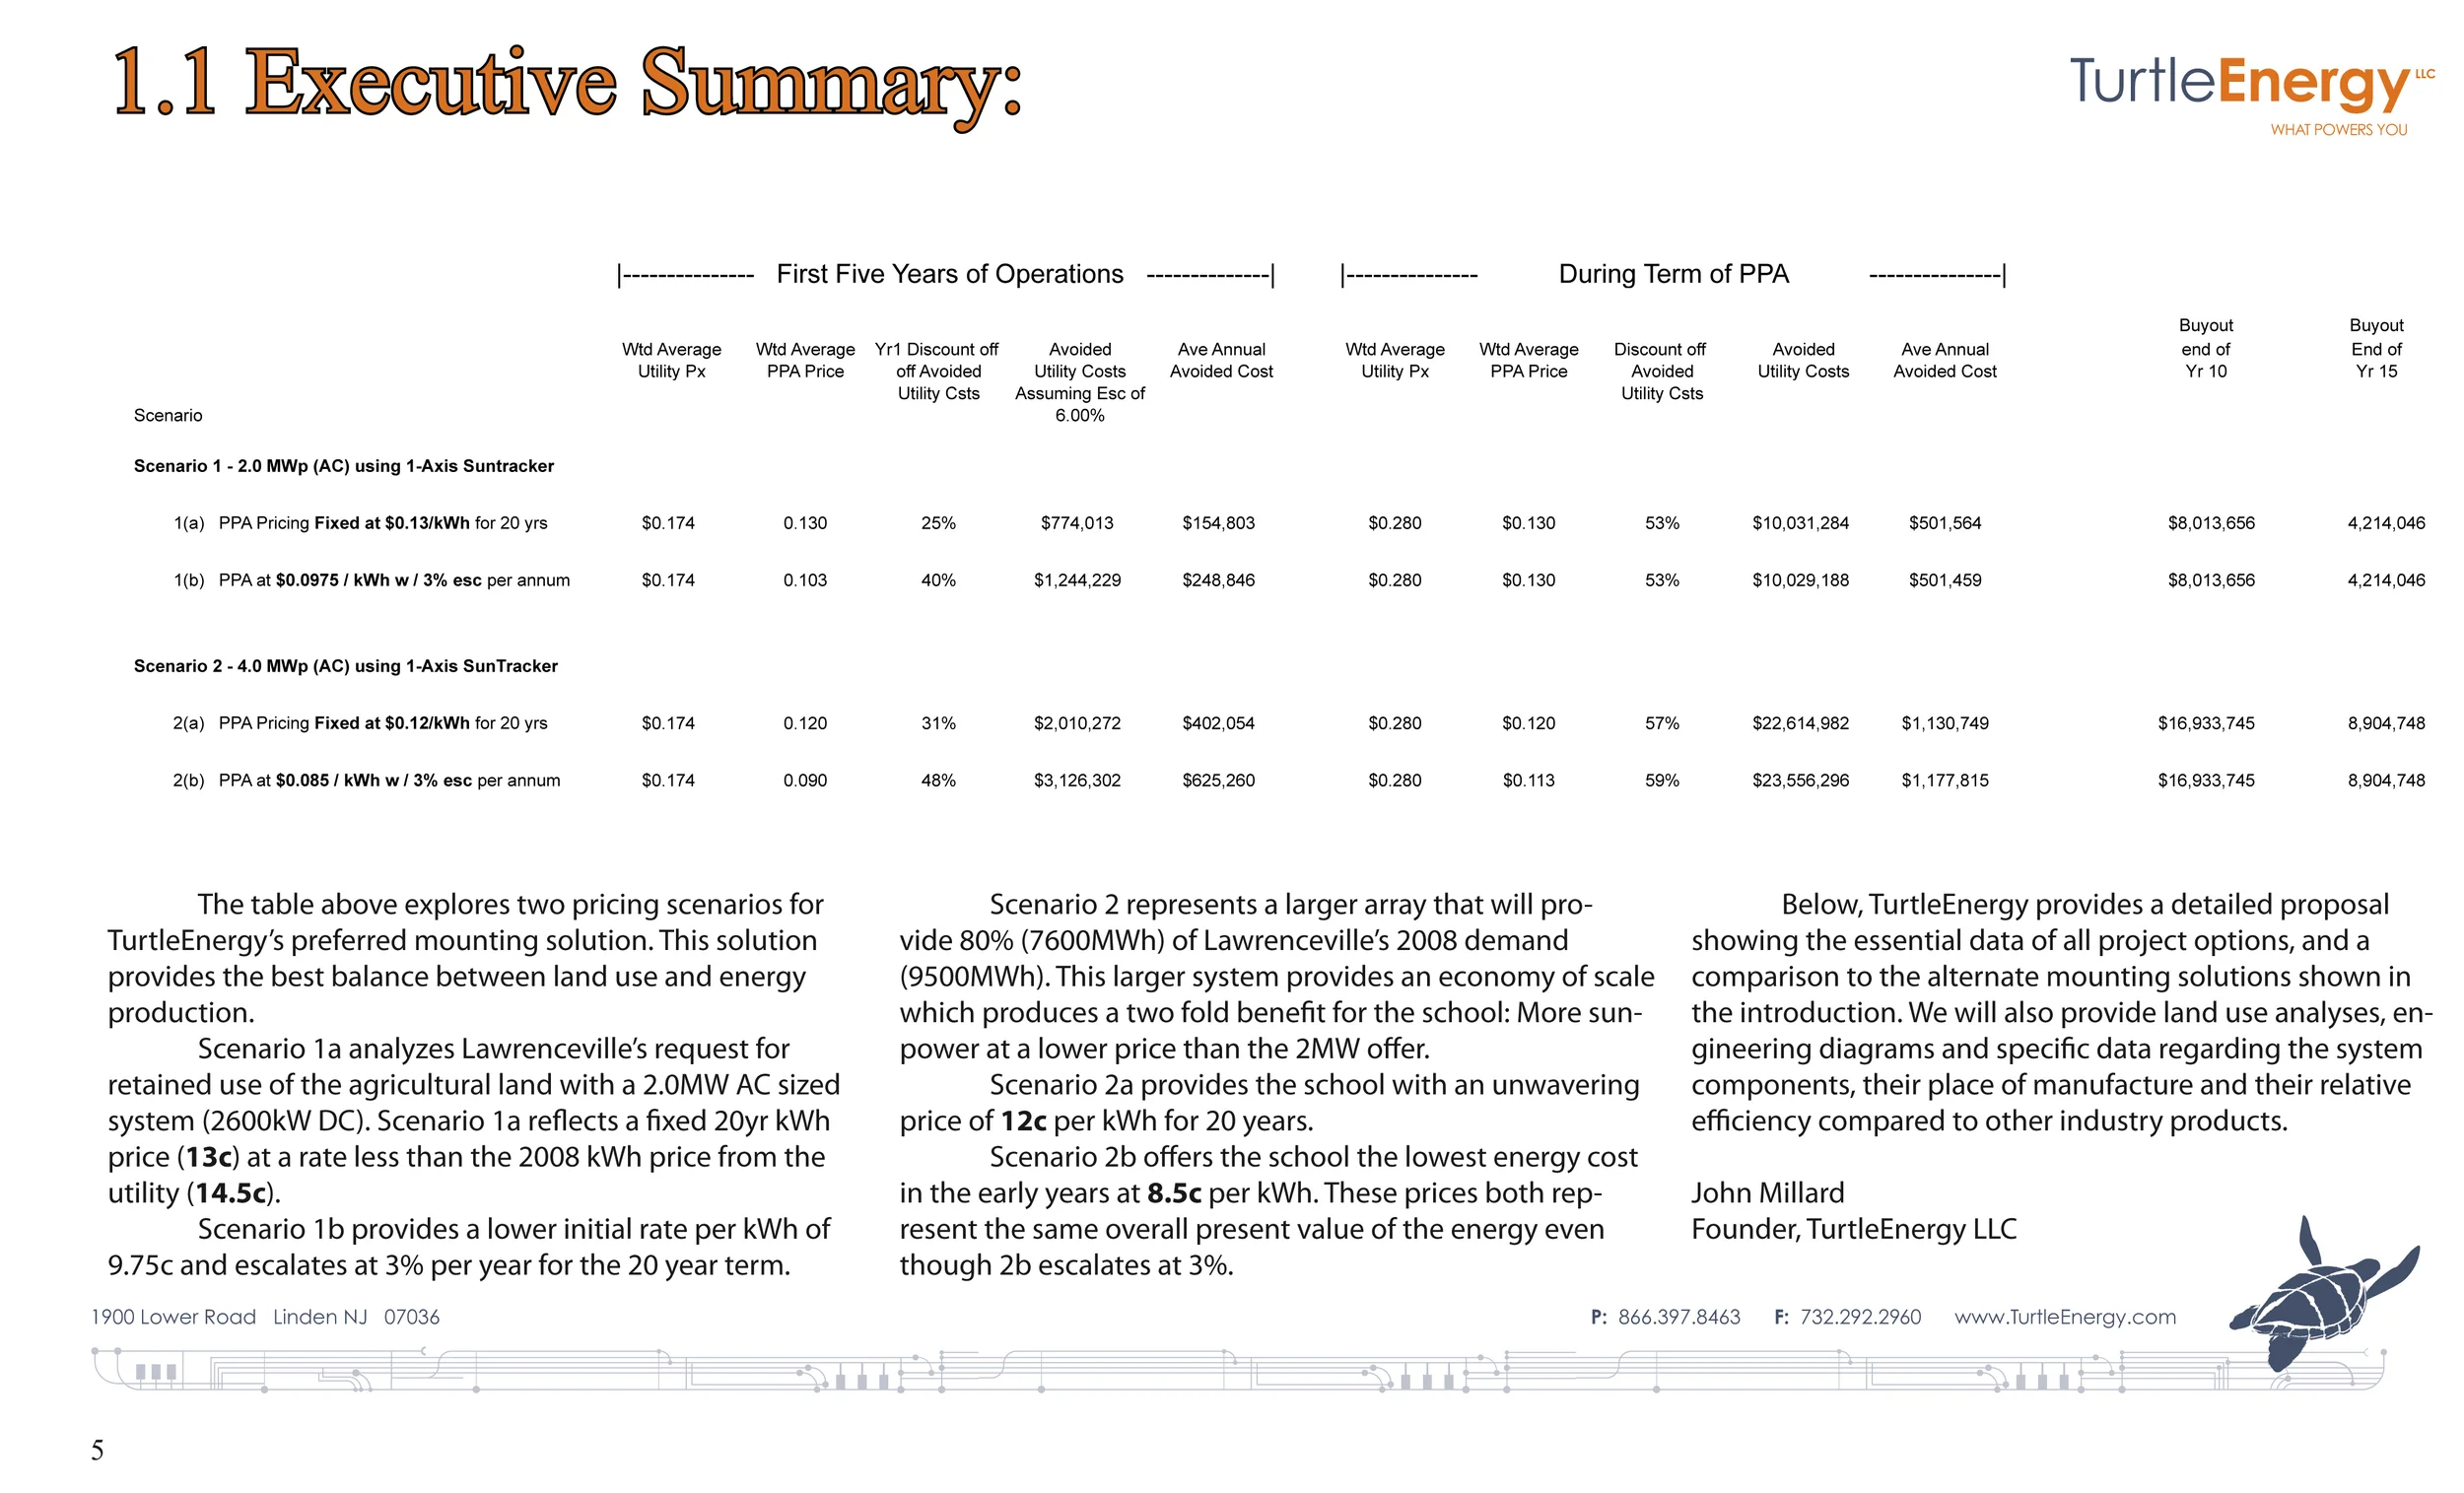
Figure 2: Electricity prices with varying escalators and system sizes/ configurations are the product of this proposal to the Lawrenceville School.
The actual price agreed with the school was significantly lowered after it was realized that the system size was going to balloon over 2.5MW and exceed 6MW due to regulatory changes made shortly after this proposal was delivered to the school.

Figure 3: A description of the project design team and the construction team constituents.
In fact, the project was constructed by other contractors than was proposed in this description. The Project, once permitted- became the ownership of a project developer named KDC Solar who acquired the project from TurtleEnergy, signed a separate power purchase agreement with The Lawrenceville School and paid for all construction costs during the 2011-2012 timeframe.

Figure 4: Business Pitch- Purchase discount electricity from a solar energy system owned and operated by TurtleEnergy on your own land/ roof.
The marketing of solar electricity to building and land owners from systems that are owned and operated by others is a well trodden path by tax equity investors, non-recourse lenders, equipment leasing companies and entrepreneurs with a spreadsheet and a handshake. The industry has seen a great shakeout- with the winners such as Solar City, SunEdison and SunPower all waiting to show a profit from the cash flows from the sale of electricity from solar projects that are only 13% of the total return on investment based on tax incentives and renewable energy credits.

Figure 5: In fact, the final system size now produces 100% of the Lawrenceville School's electricity needs.
Schematic Design & Solar Proposal Representations- How large a system can I design for this client? Despite the 2.0 MW AC cap on the size of solar electric systems in the State of New Jersey- pending legislation at the time of this proposal was about to enable us to design a 5MW AC sized system. This systems size would result in 9500MWh per of electricity production. But there were no guaranteed methods of calculating this quantity and the only other single axis tracker in the state was only 500kW- 10X smaller than the system that we were contemplating in this proposal. That system, according to our competitor produced 1.4MWh per installed DC KW per Year therefore, we were expecting approximately 8500 MWh per year. Ultimately, module efficiencies would increase sufficiently to ship 255 Watt modules to the project instead of 245W- and with 24,492 of these 255W modules the system size was 6.245MW DC and it produces 1.47 MWh per installed DC KW per Year (2014) for 9200 MWh in 2014. (100% of the 2014 electricity consumption at The Lawrenceville School)

Figure 6: The tracker pictured, mounts two rows of modules in landscape format- is a huge lateral load.
Most single axis trackers mount one row of modules in portent orientation. This reduces the area affected by the wind. By reducing the lateral load on the piers- the piers can be reduced in size which makes them easier to drive into the ground and reduces cost. The tracker pictured attempts to do both- maximize the solar panels per post and minimize the post size. This would prove to be a miscalculation, as we were to discover from a friend who alerted us to a recent failure in Nevada.

Figure 7: This 4.6MW system size and shape is close to the completed design.
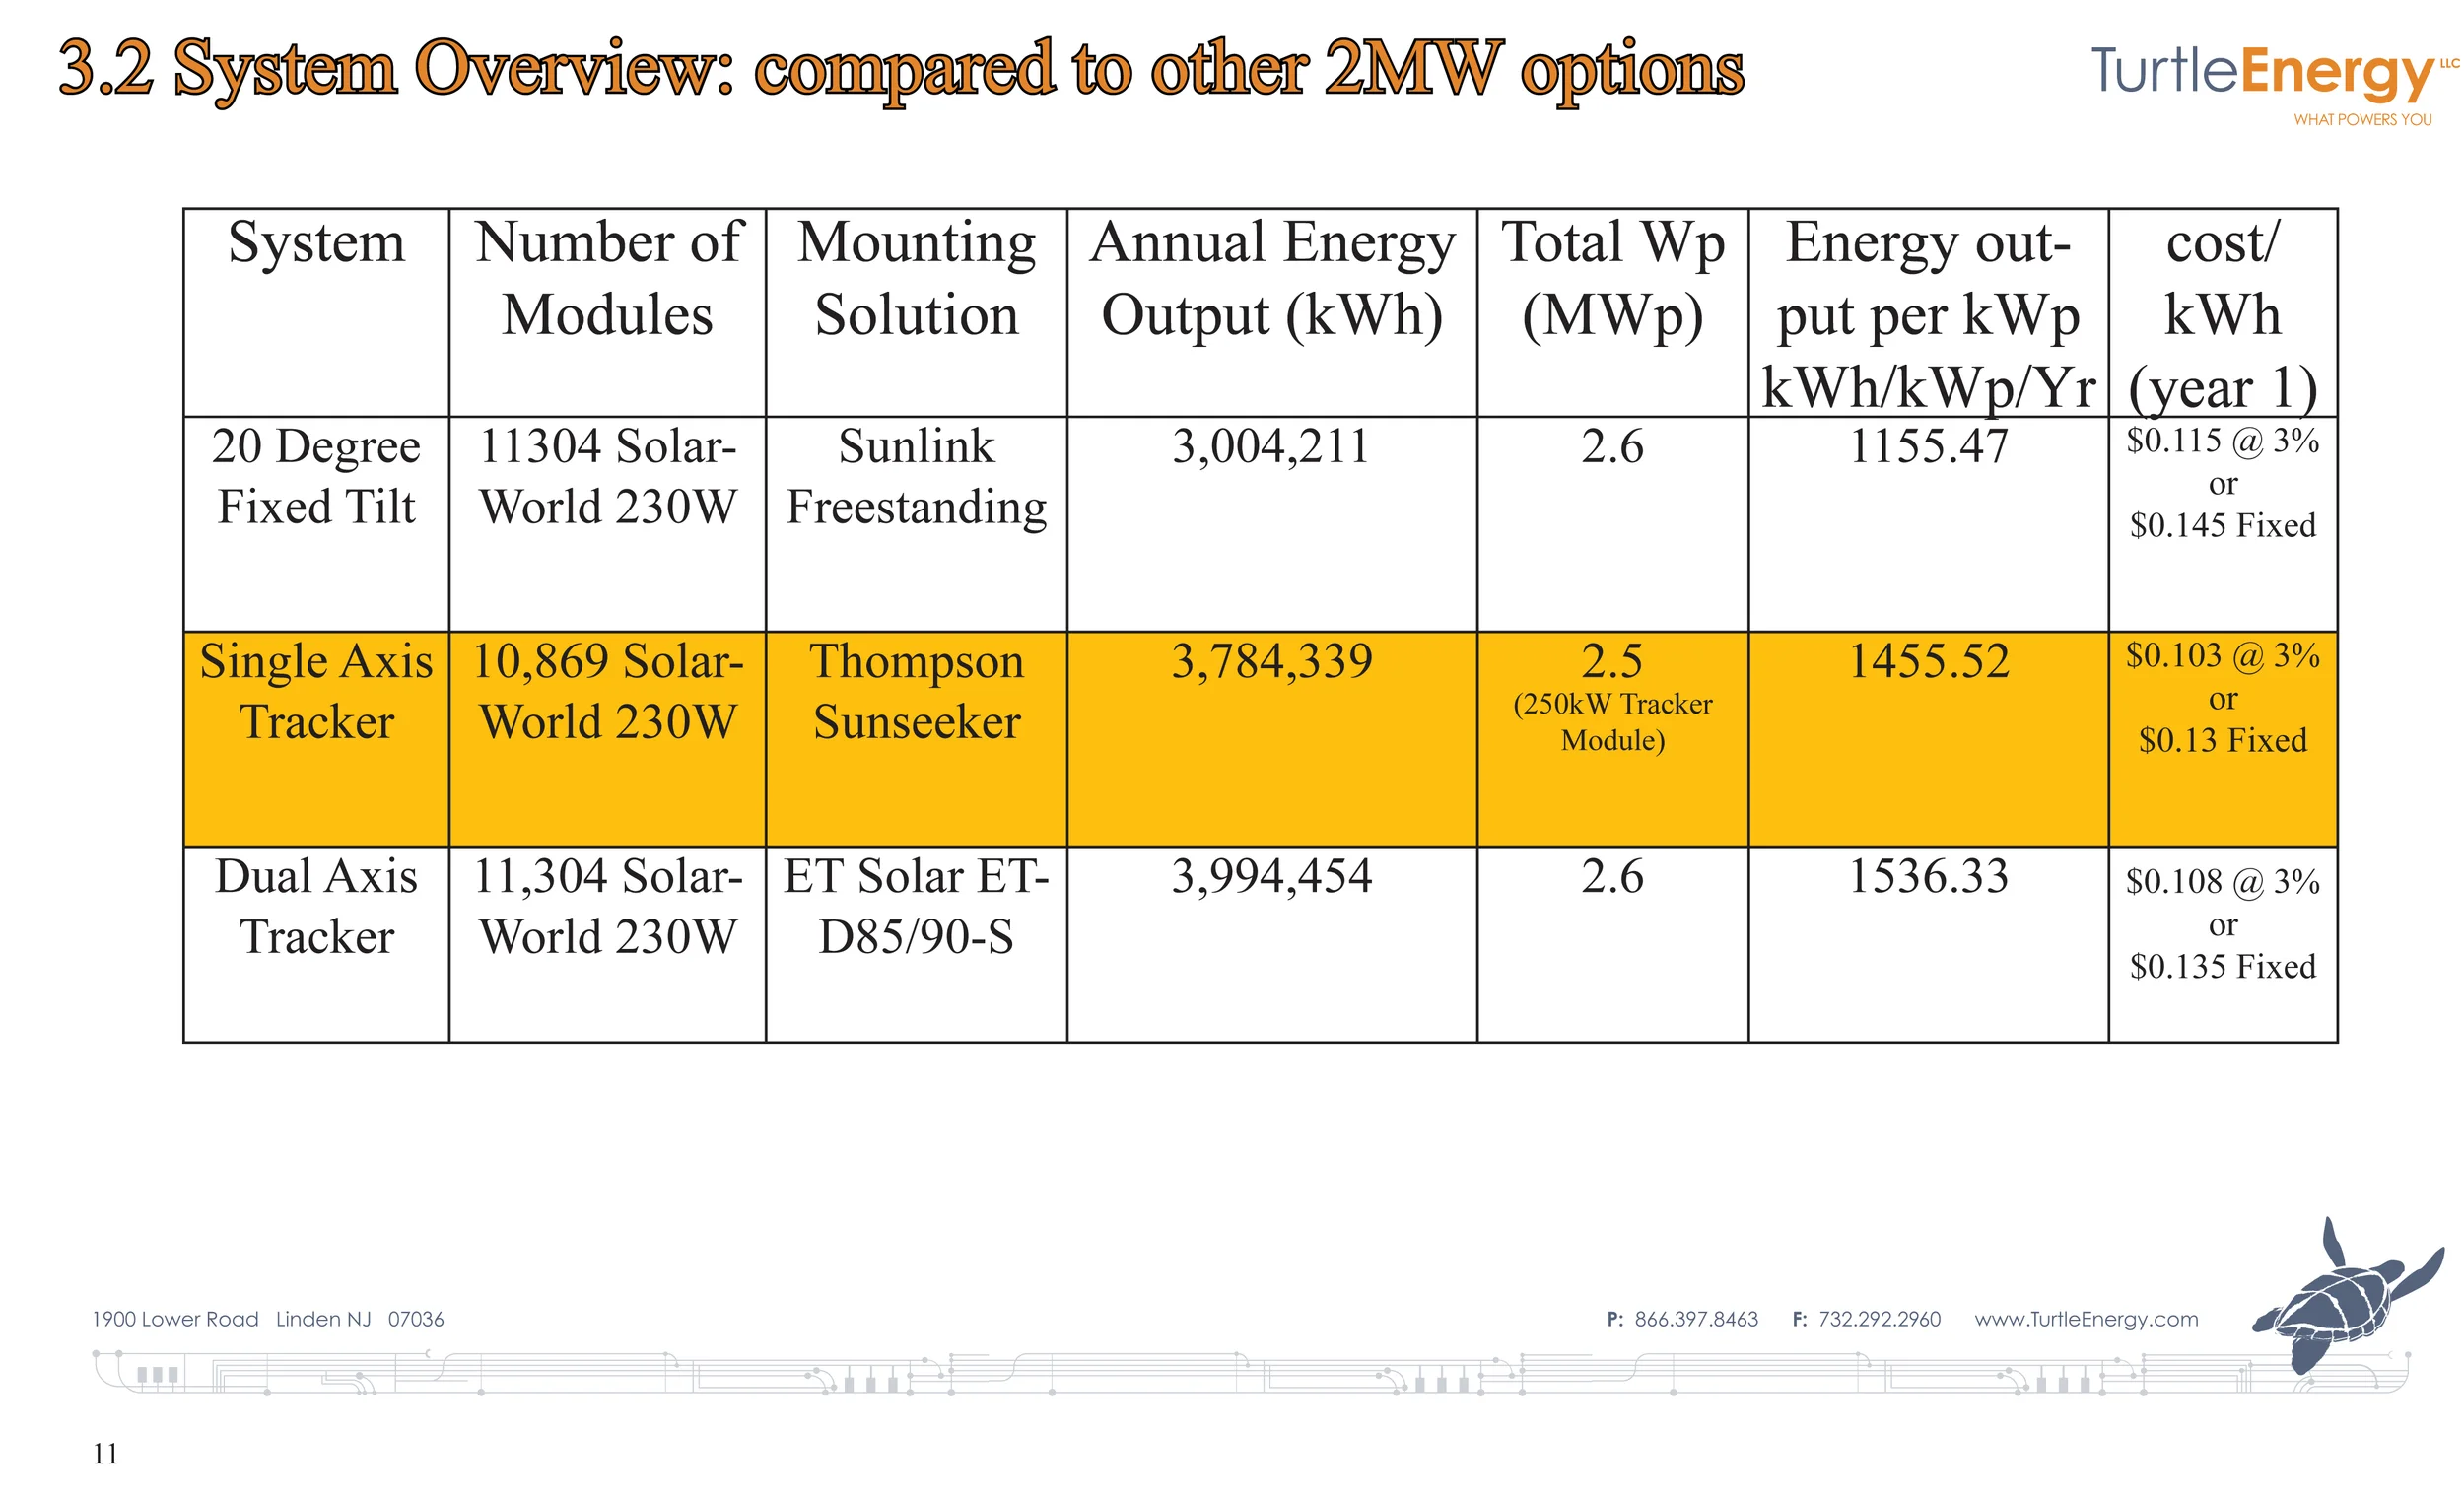
Figure 8: Varying System Sizes, Mounts and Performance
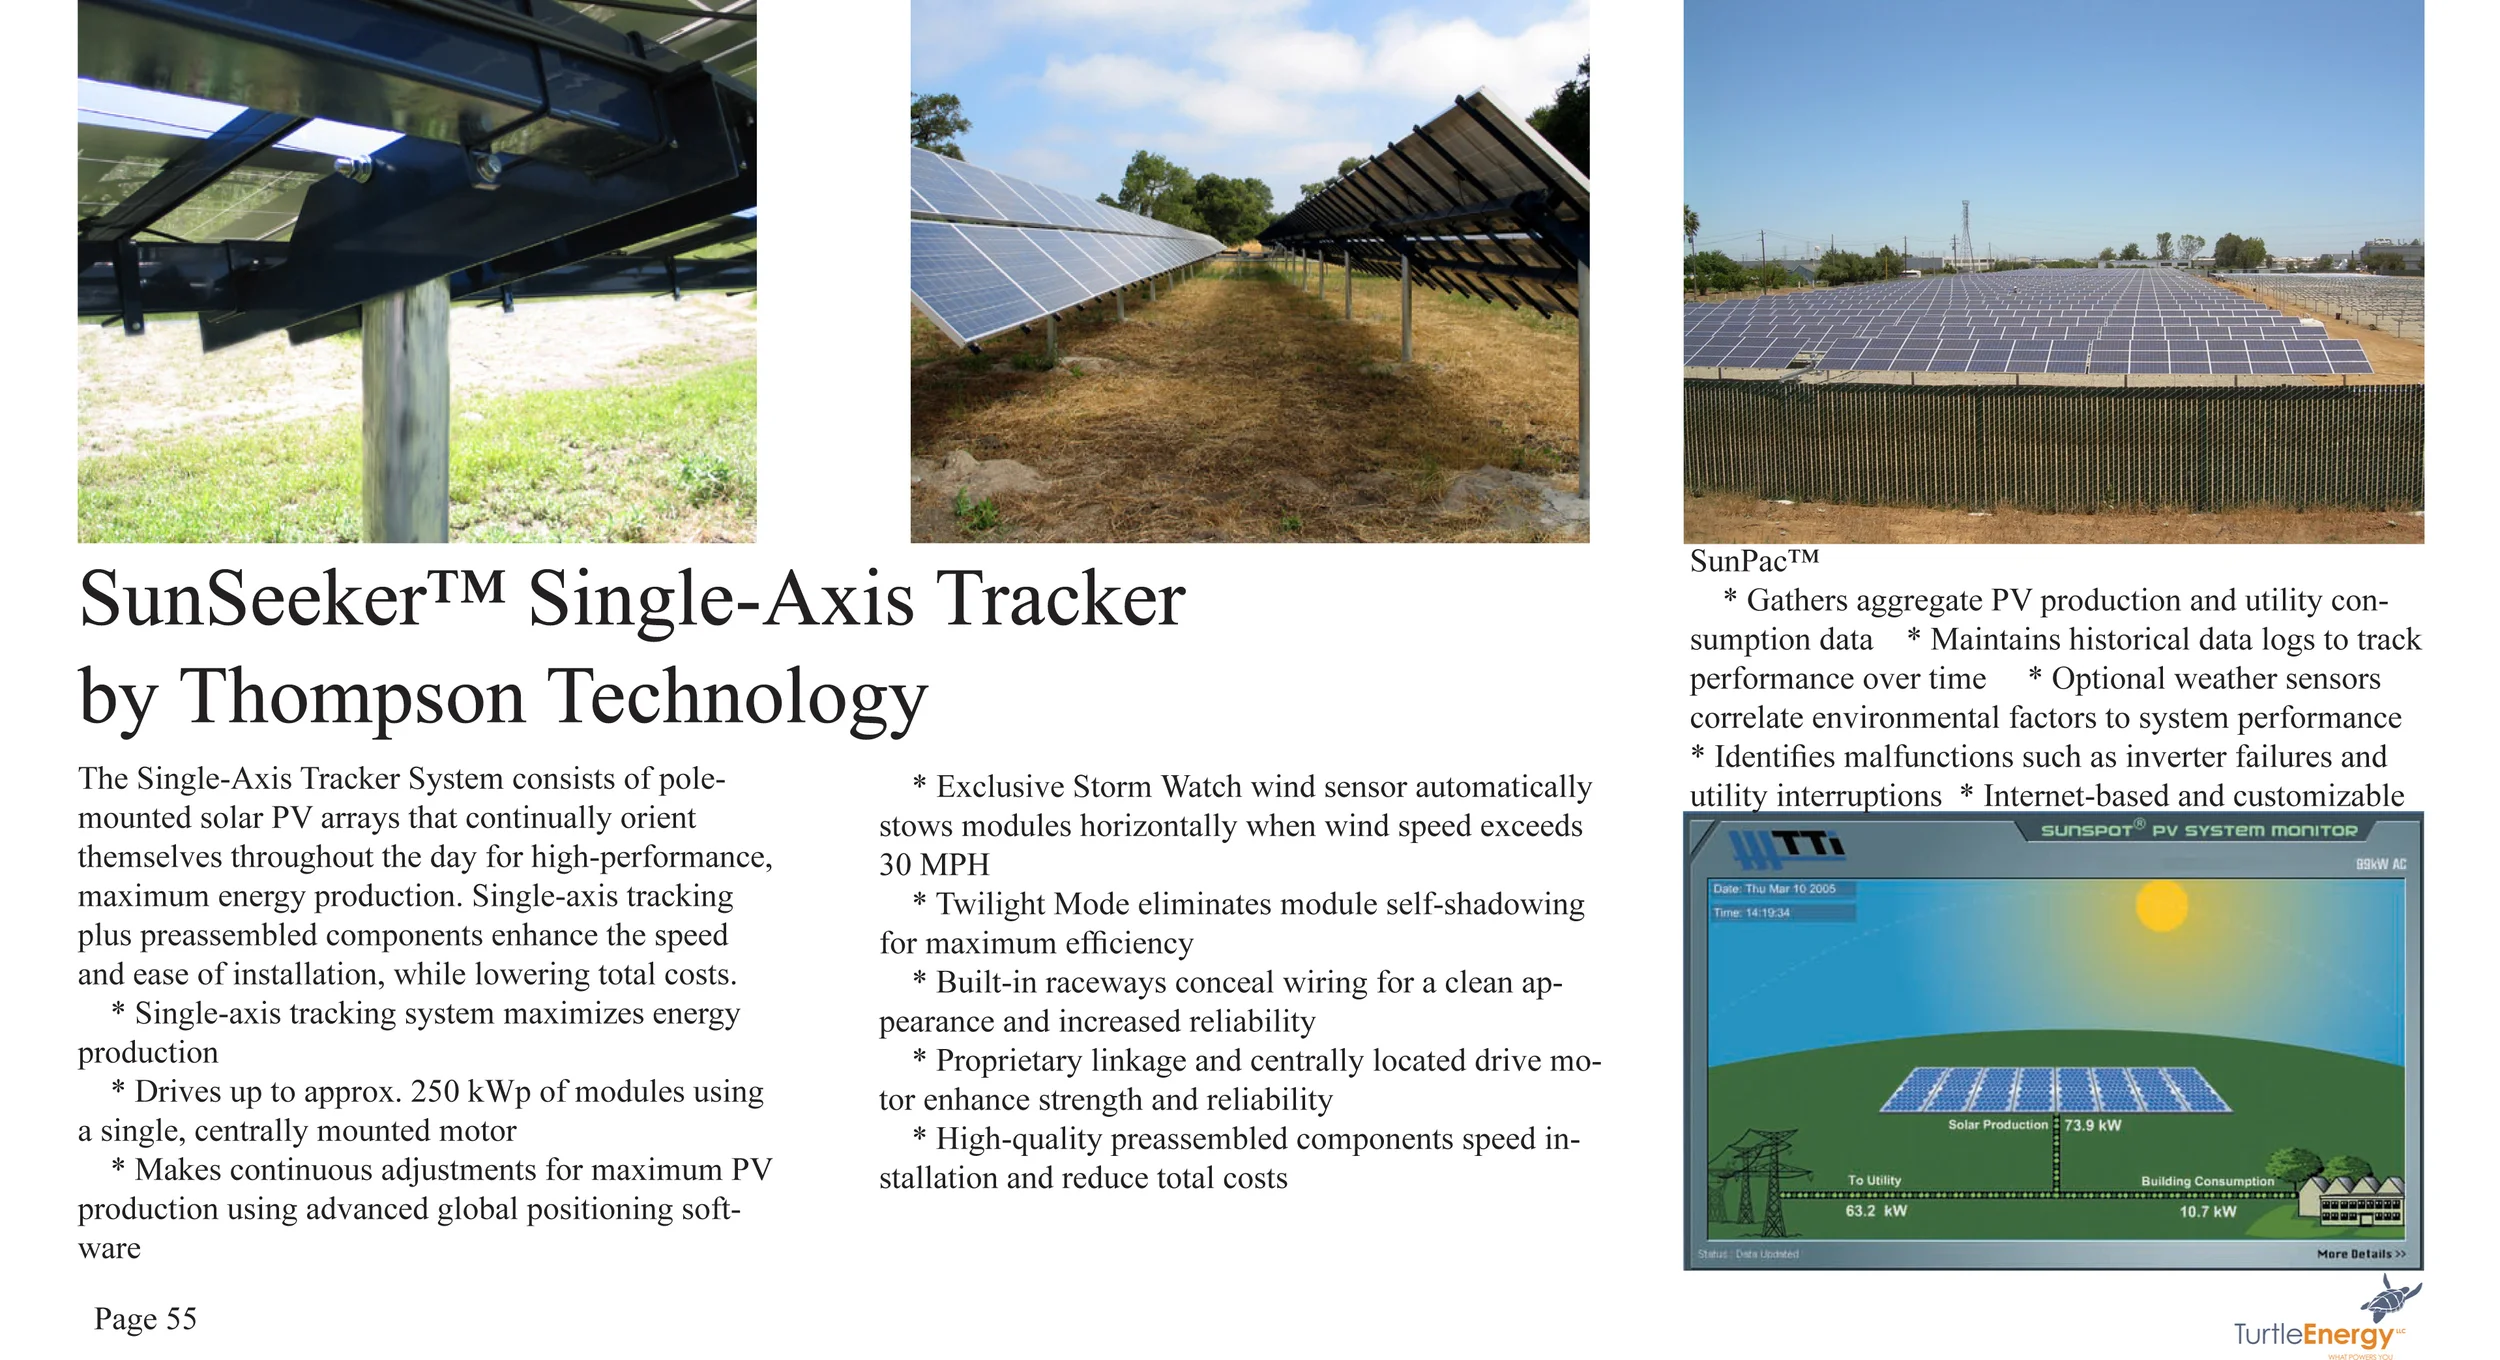
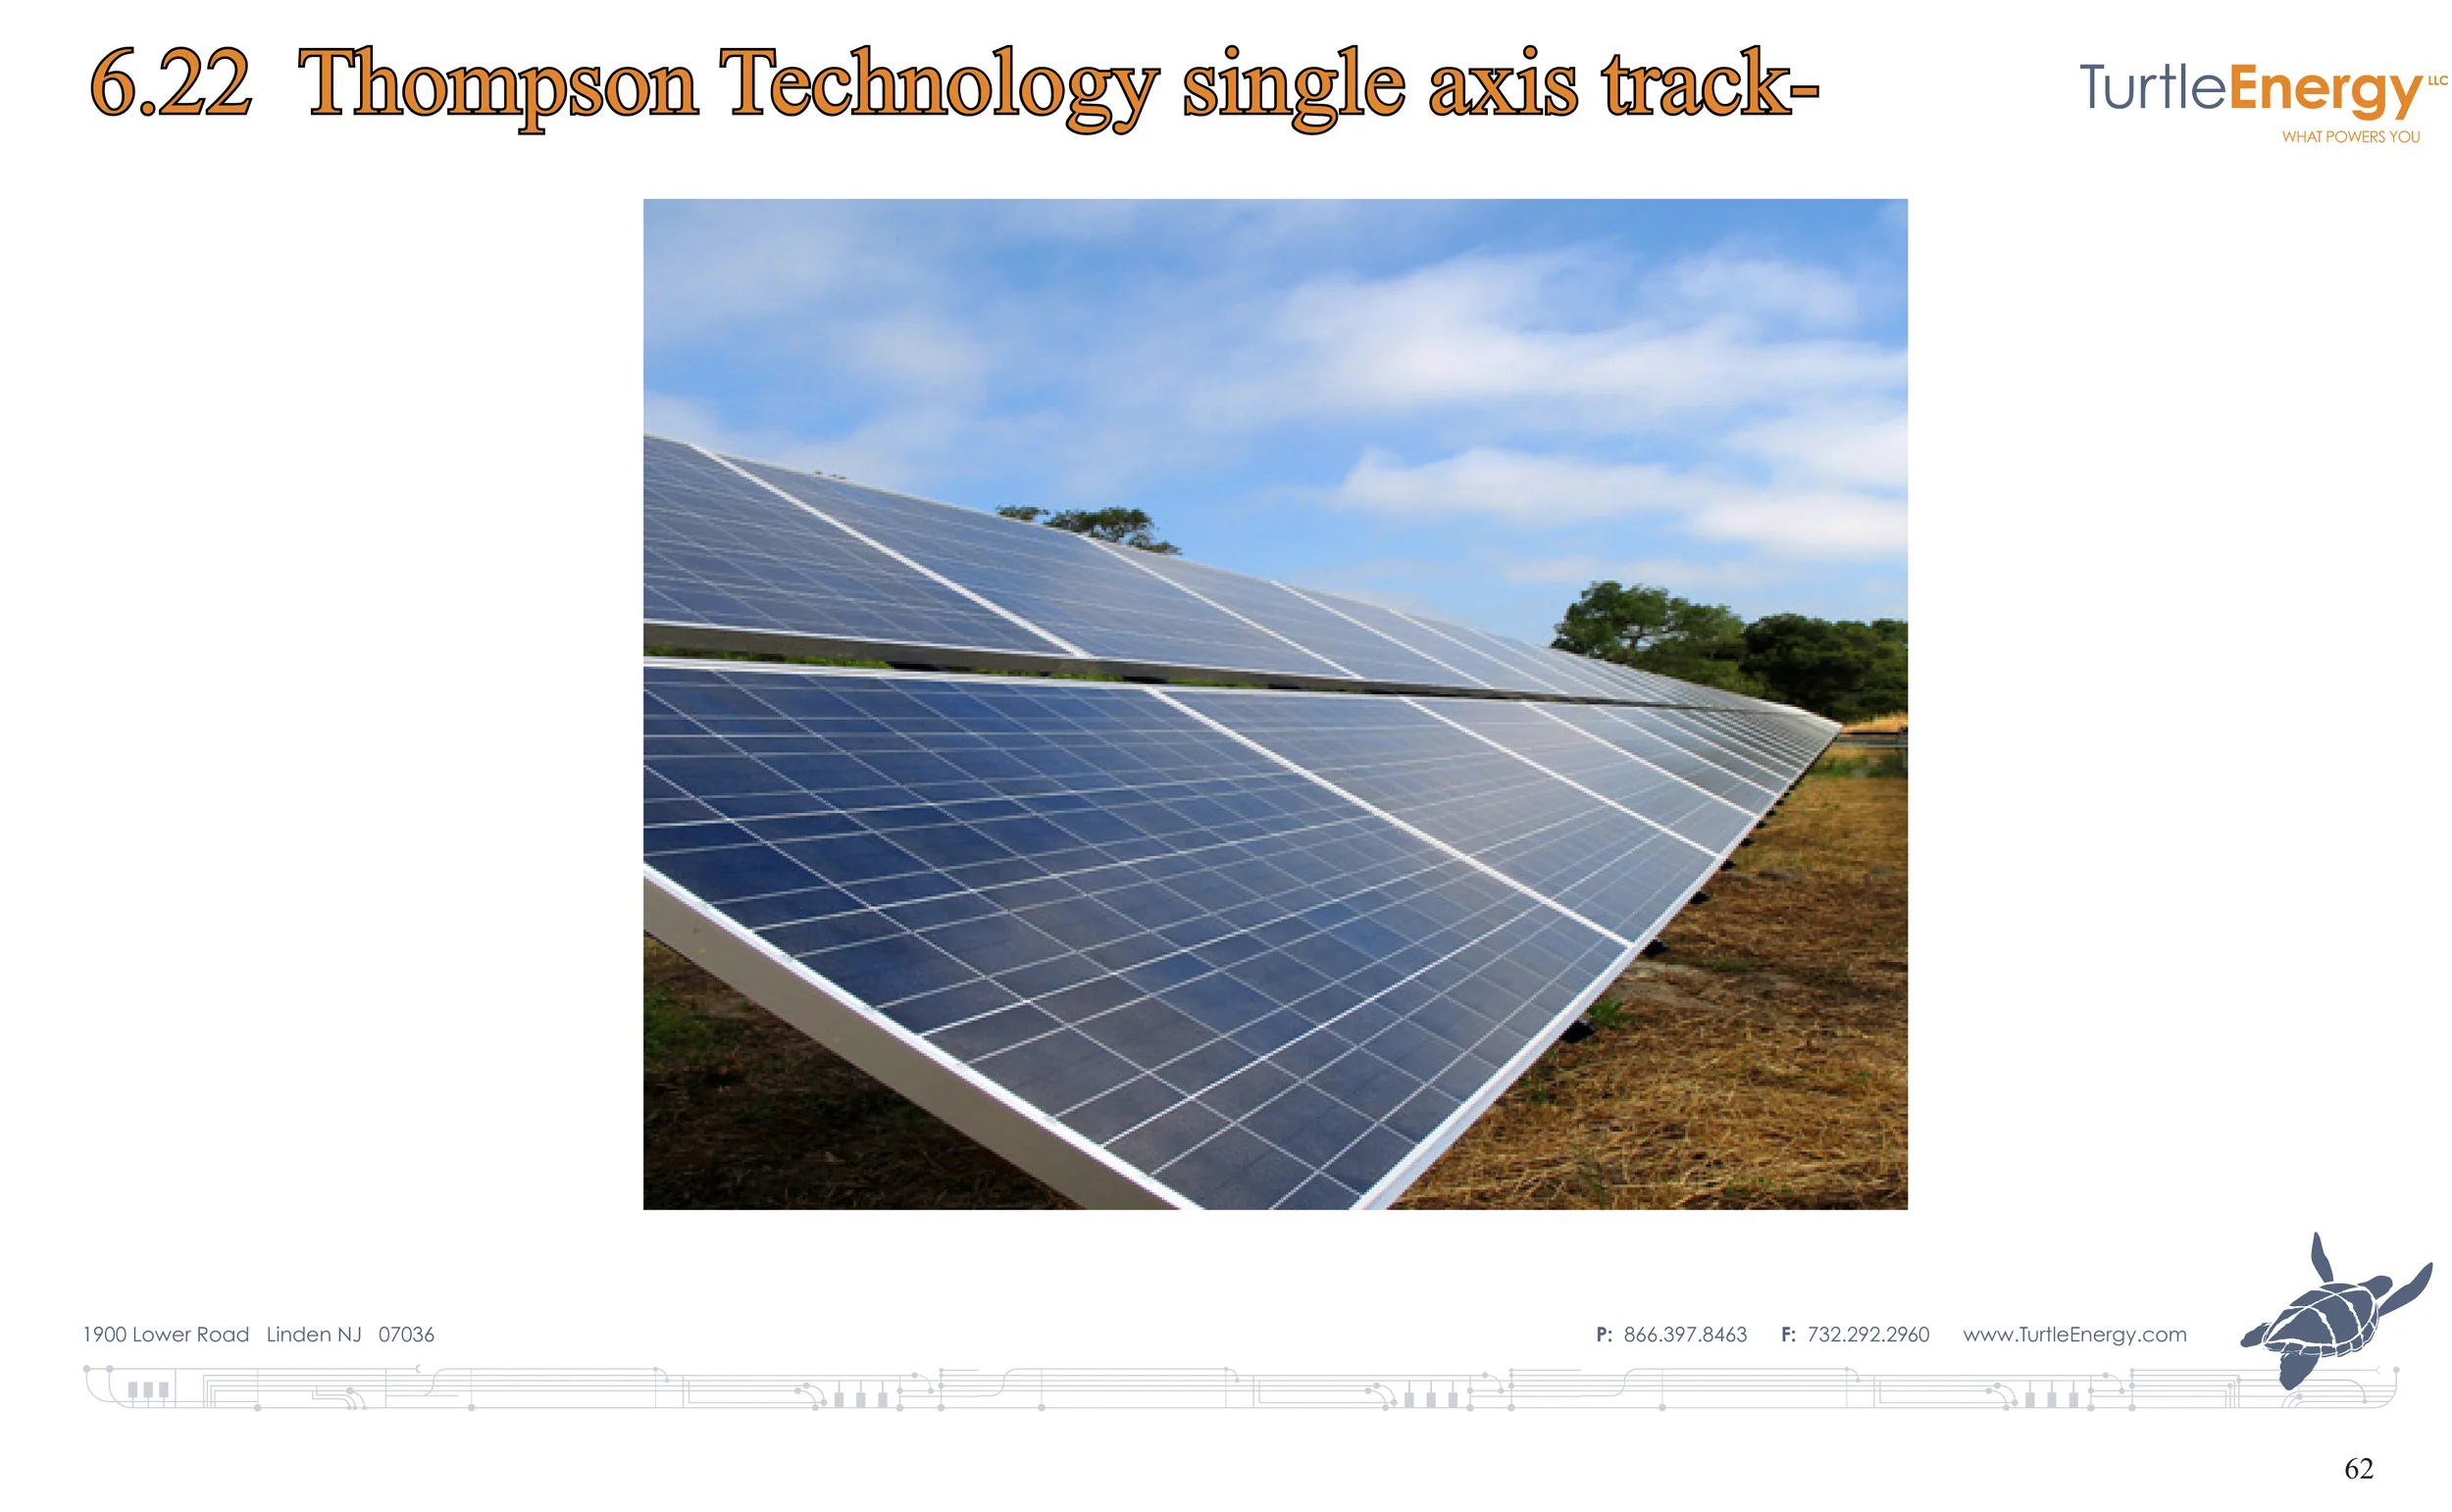
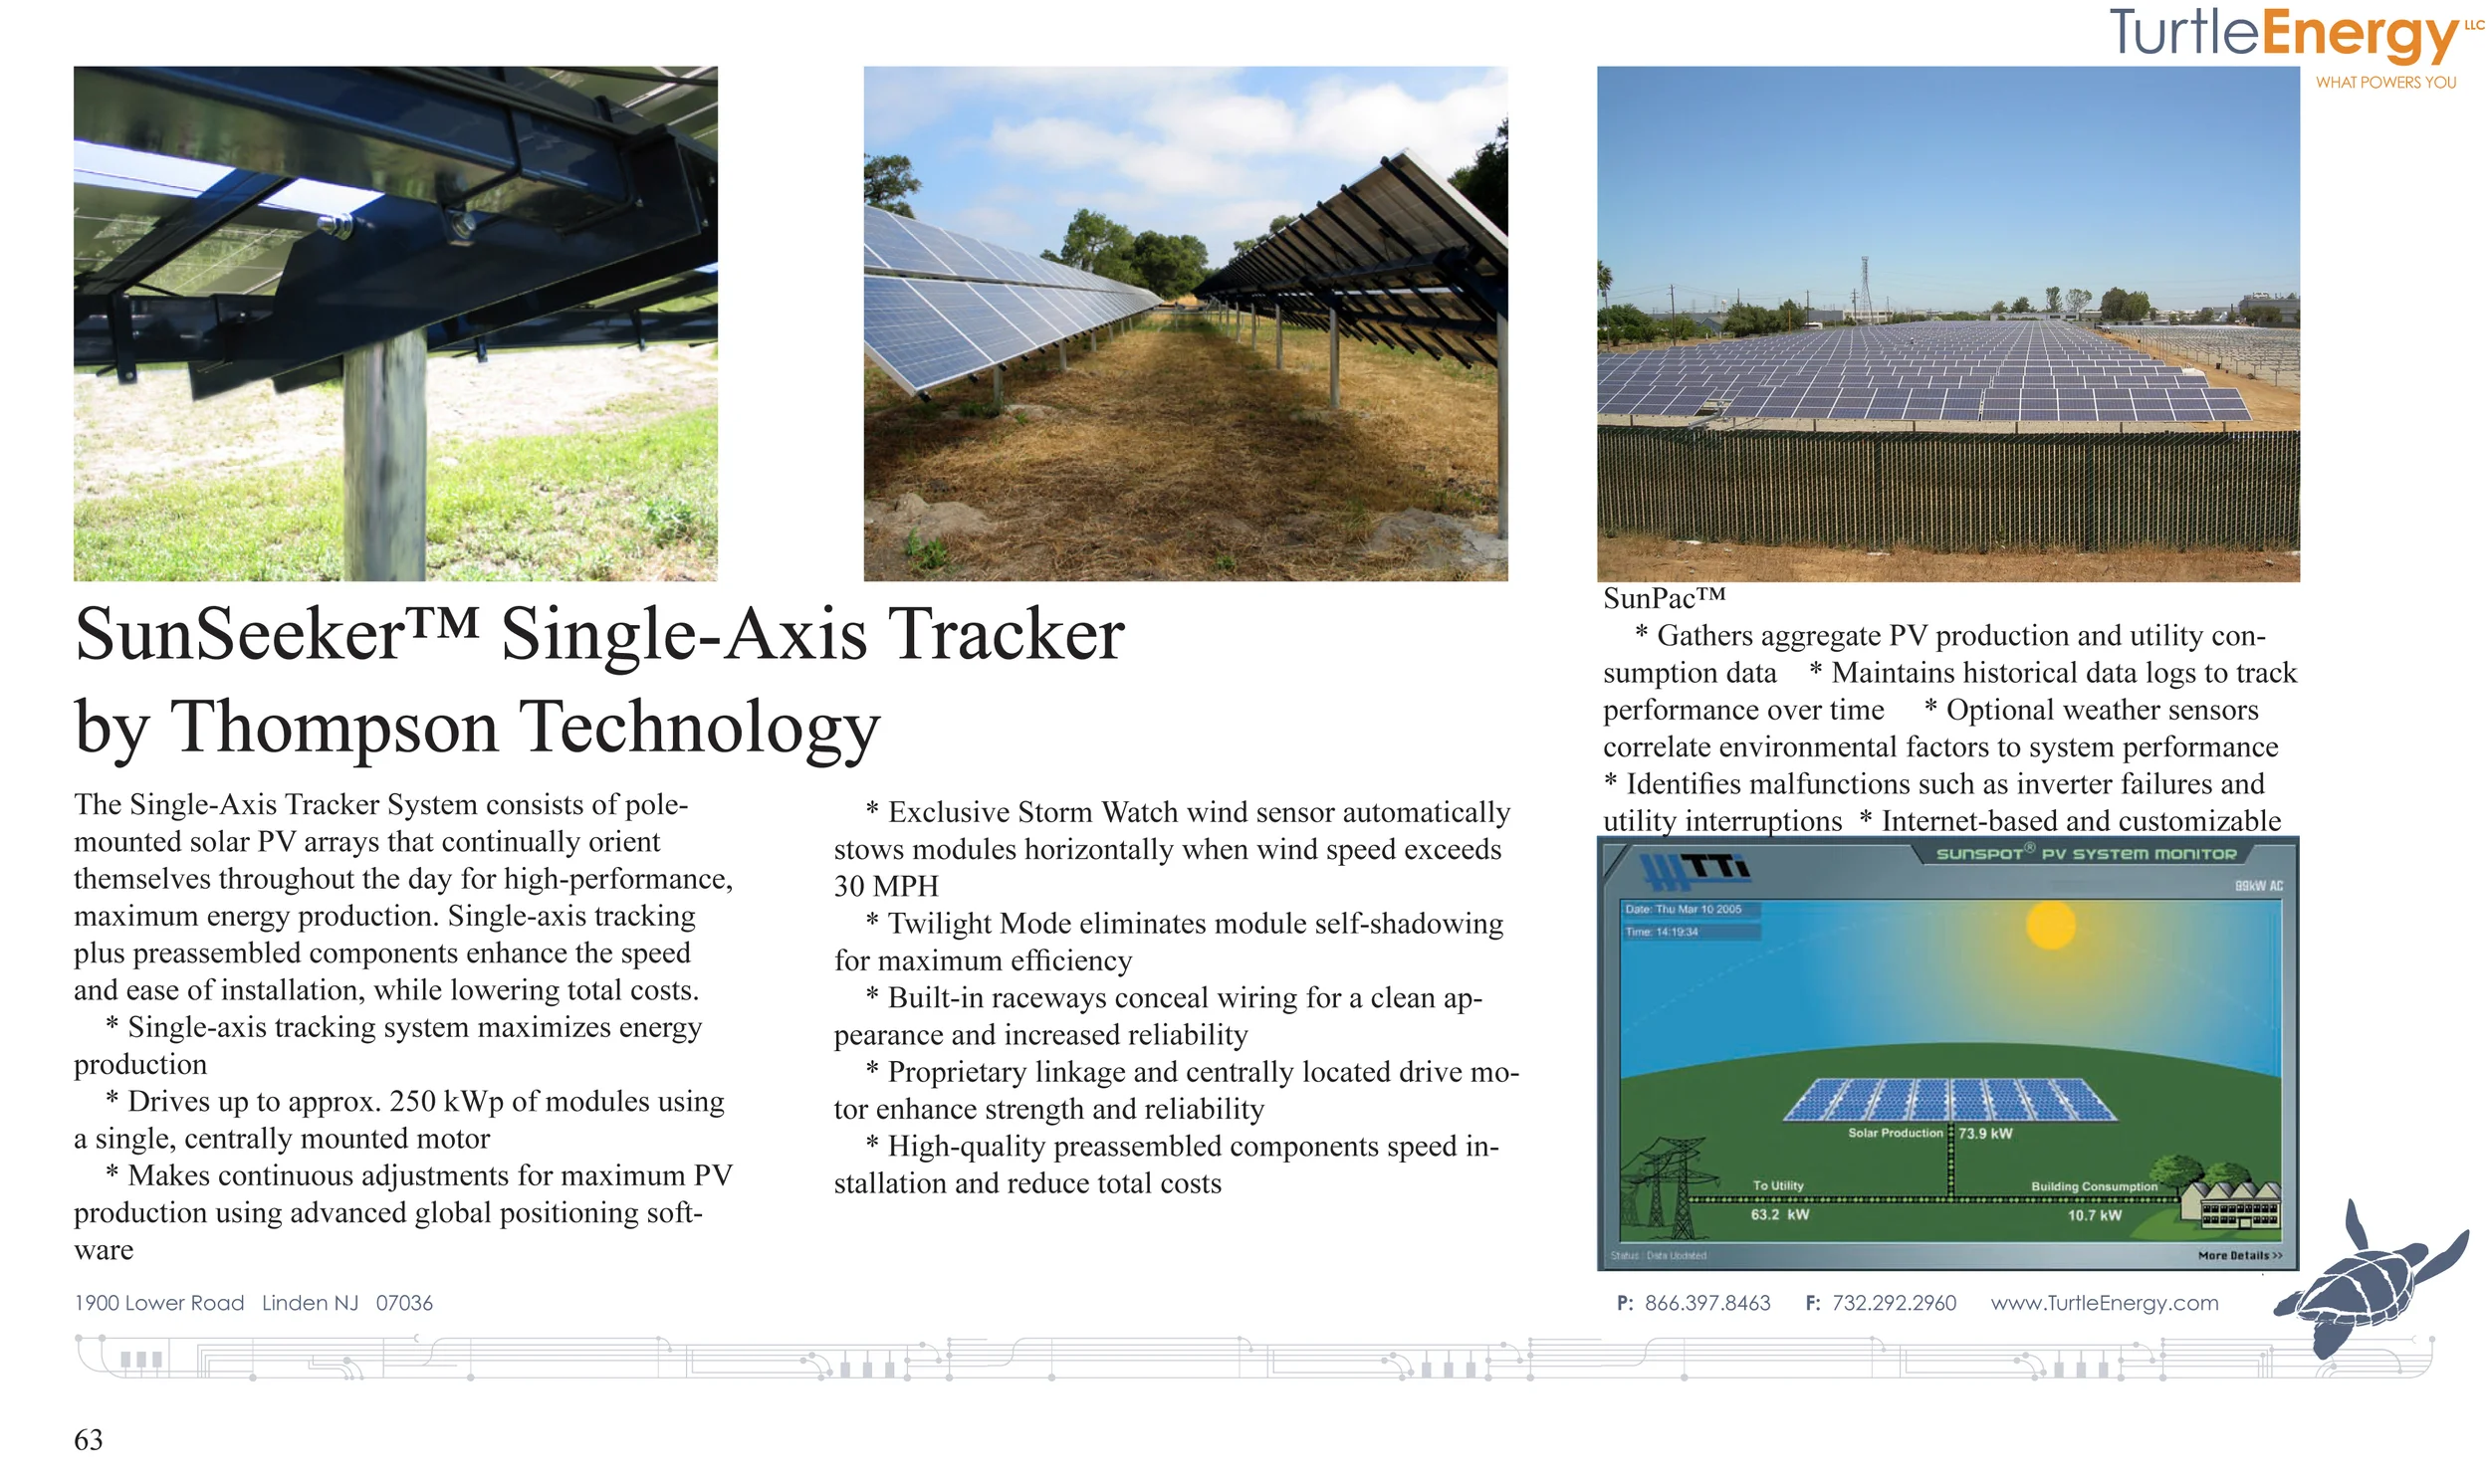
Figure 9: As can be seen from the undercarriage of this tracker by Thompson Tech- mounting two modules in landscape is cumbersome.
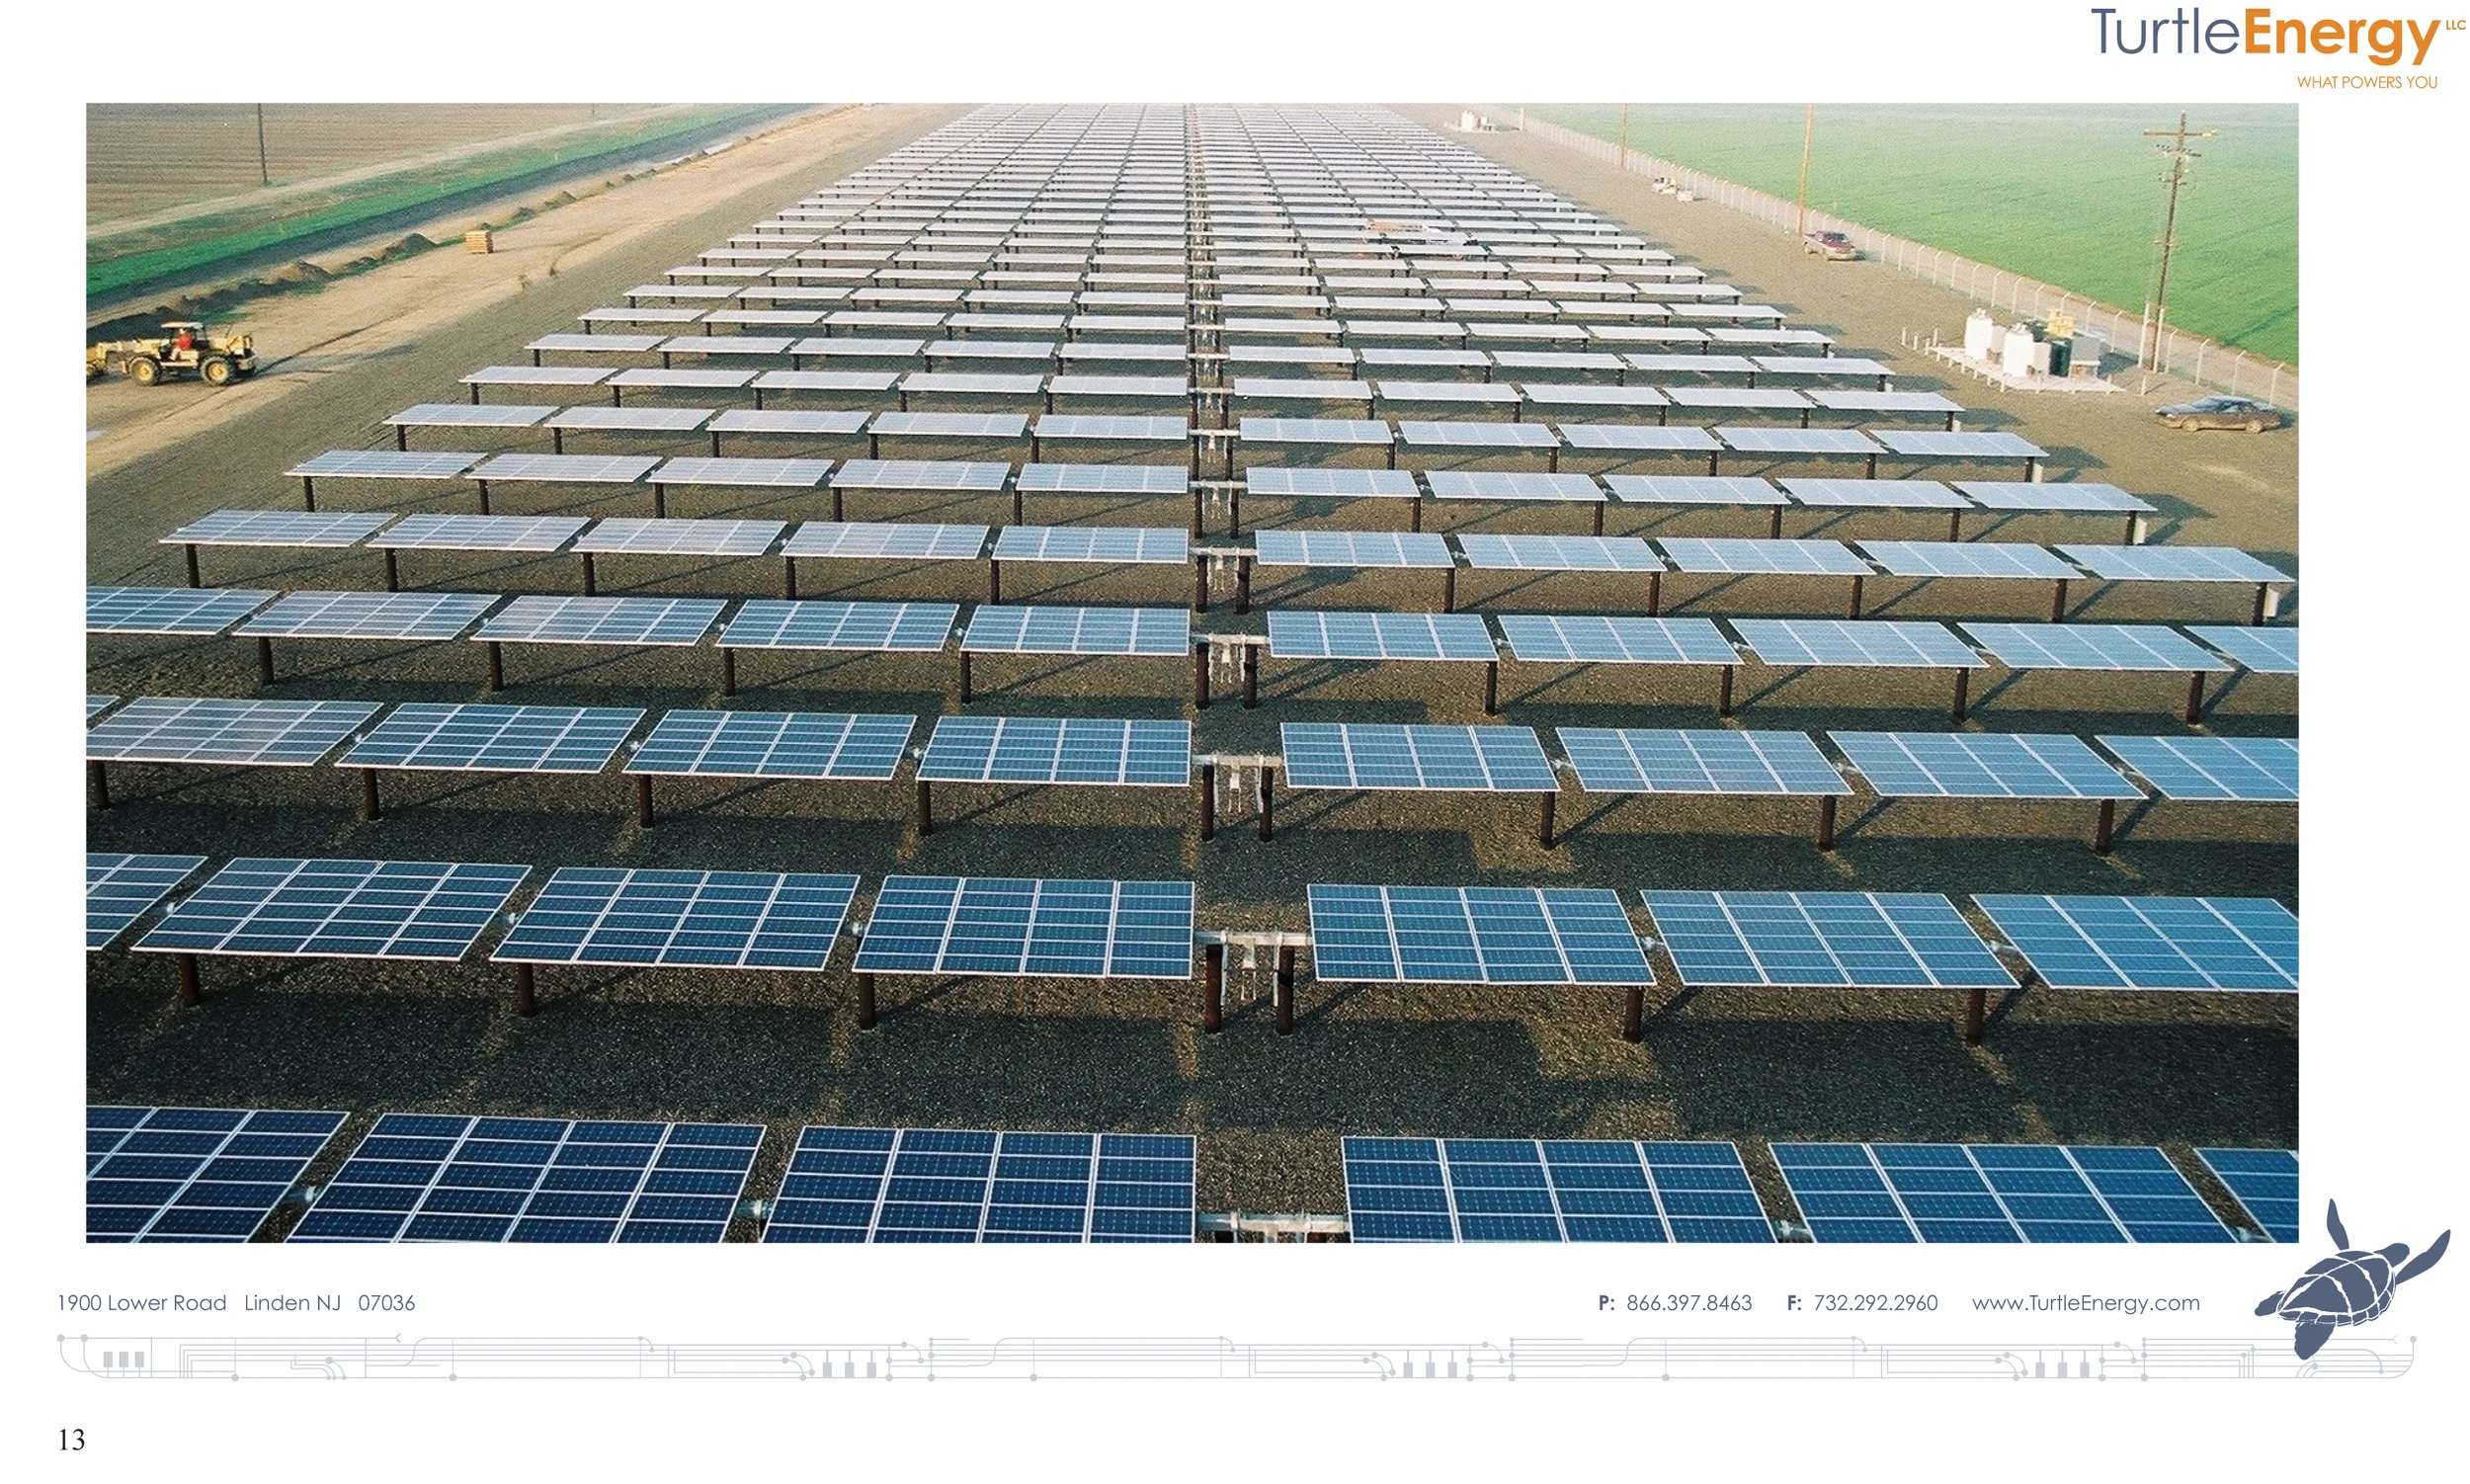
Figure 10: Another overloaded single axis tracker with five modules in landscape.

Figure 11: Solar Schoolhouse is a non-profit that would provide teaching and workshops for Lawrenceville students to increase solar knowledge.
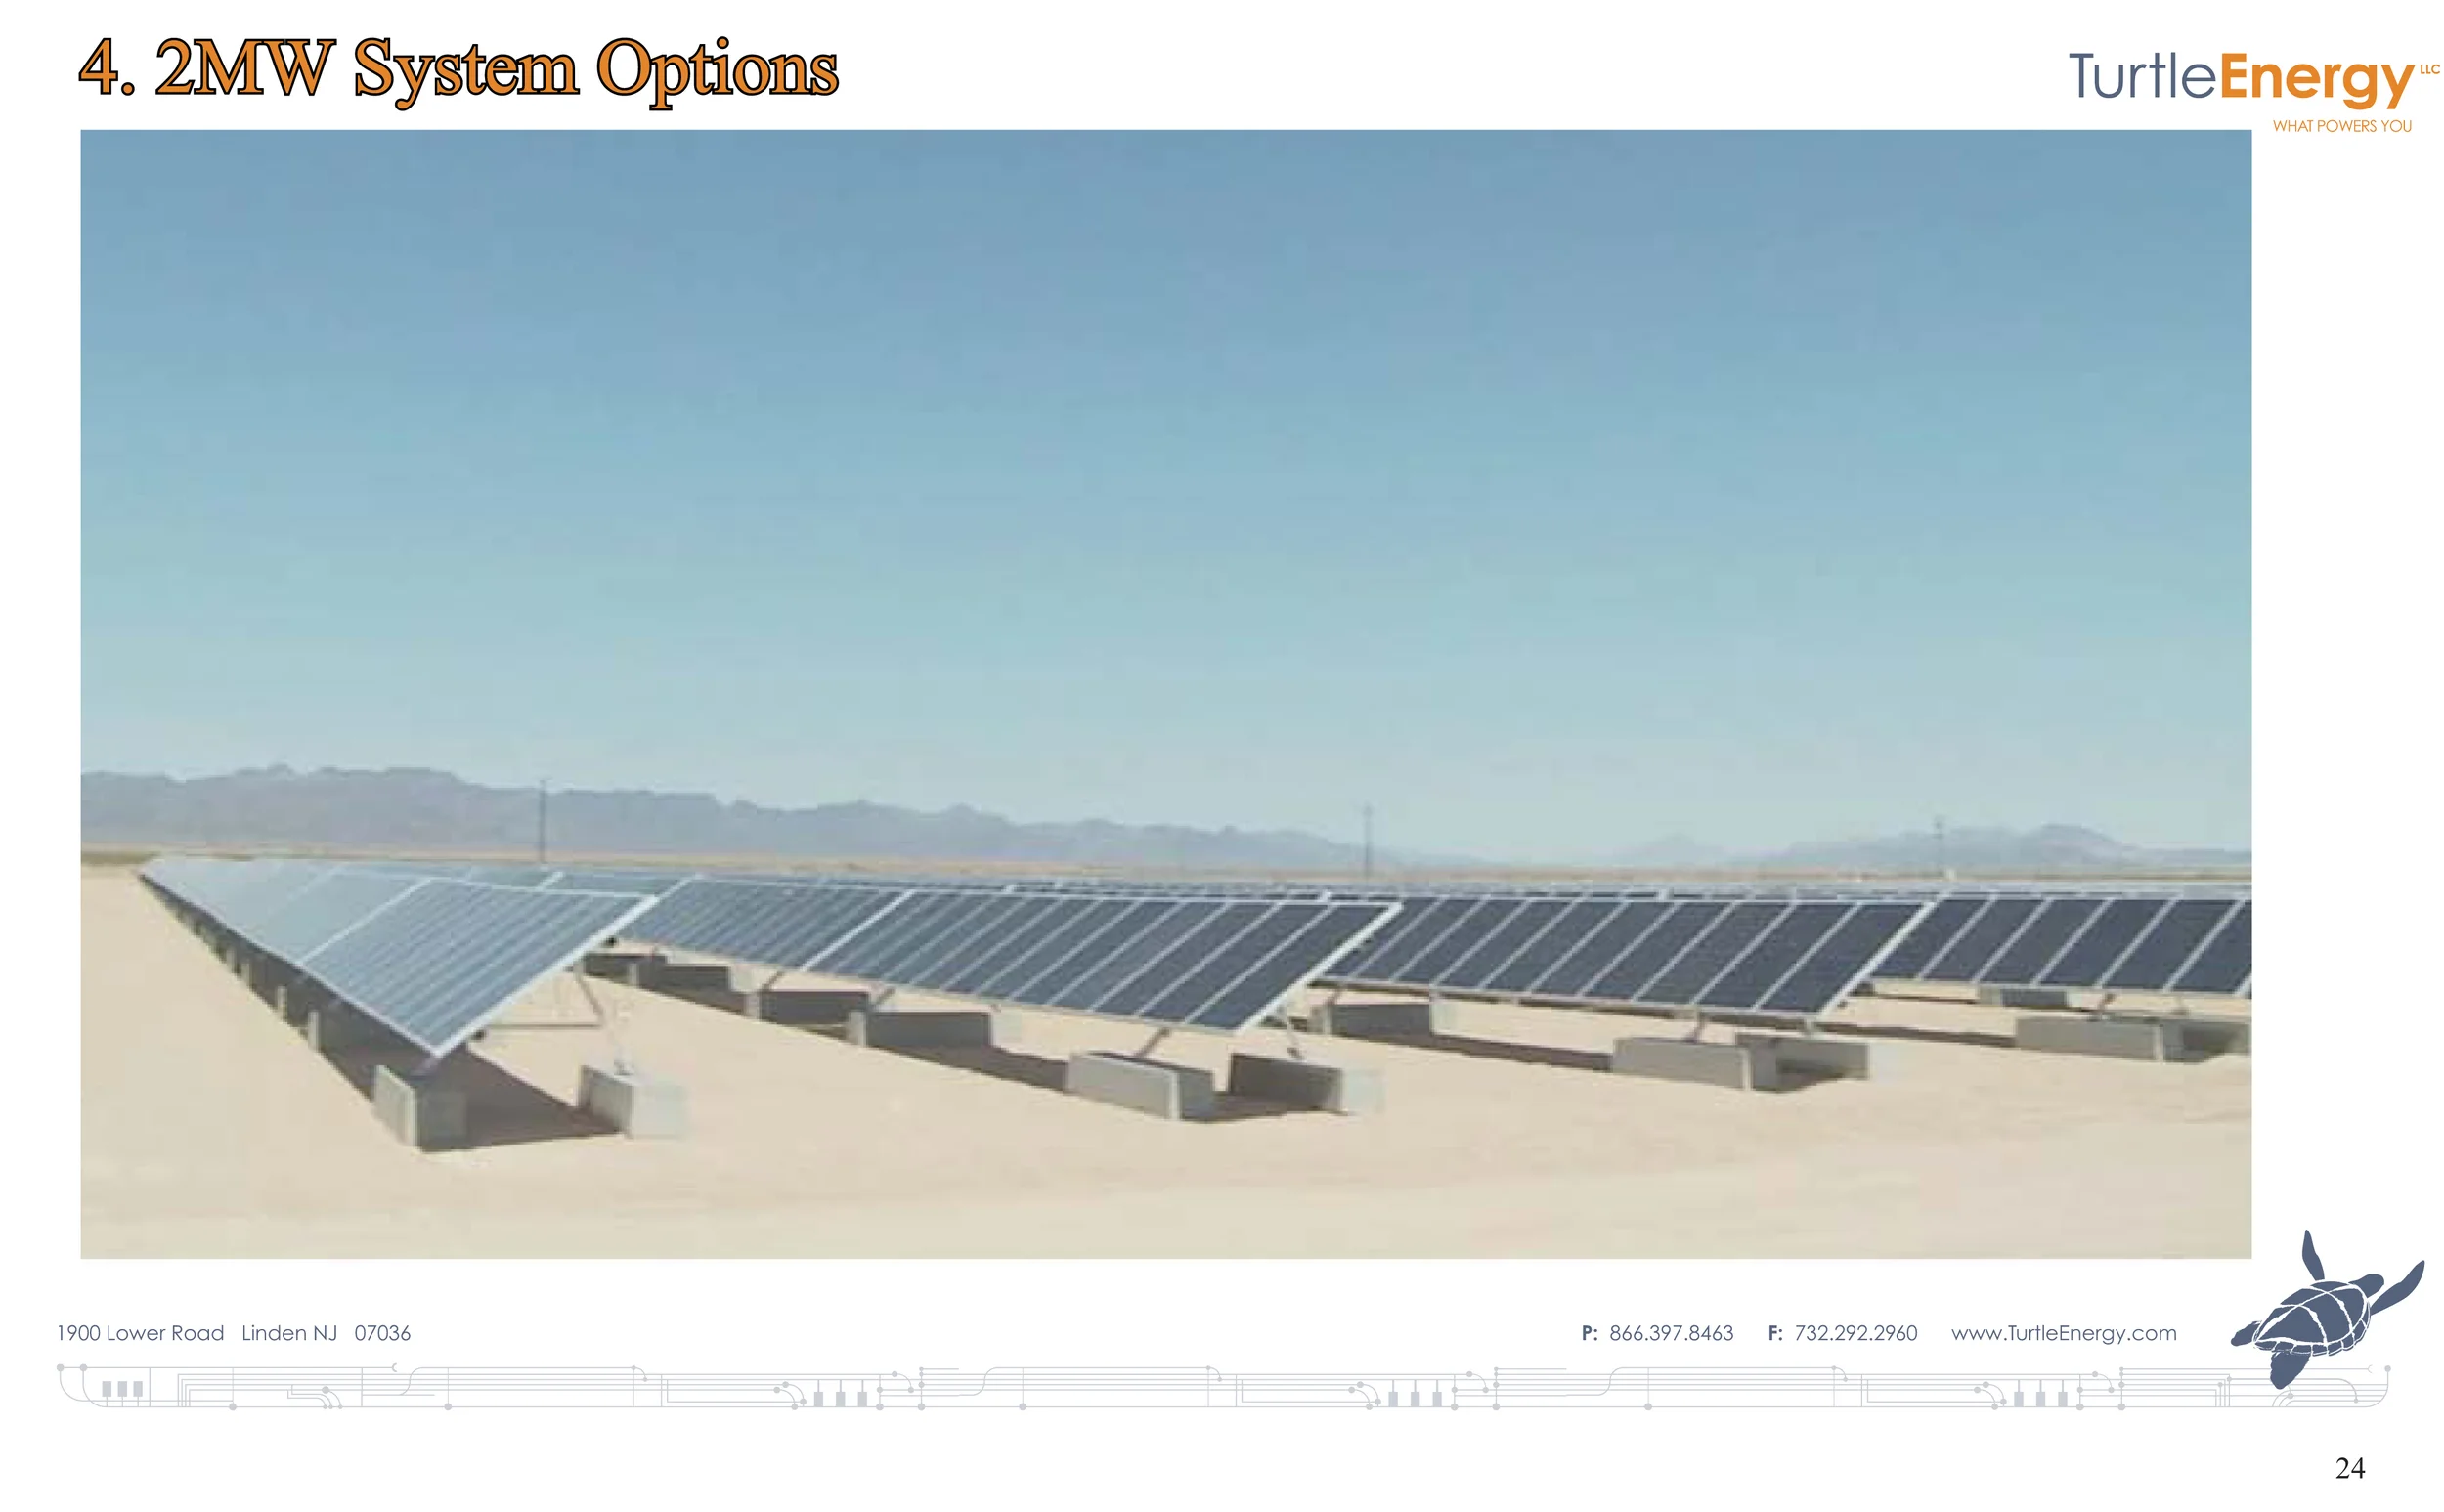
Figure 12: Fixed Tilt, Self Ballasted System by Sunlink requires no geotechnical risk to be taken/ no drilling, driving or digging.

Figure 13: Fixed tilt systems can assume just about any plan shape, accommodate any shaped space and not suffer any performance derate.

Figur 14: This smaller sized tracker is a building block for much larger systems and is rectangular in shape with compact ground coverage ratio.

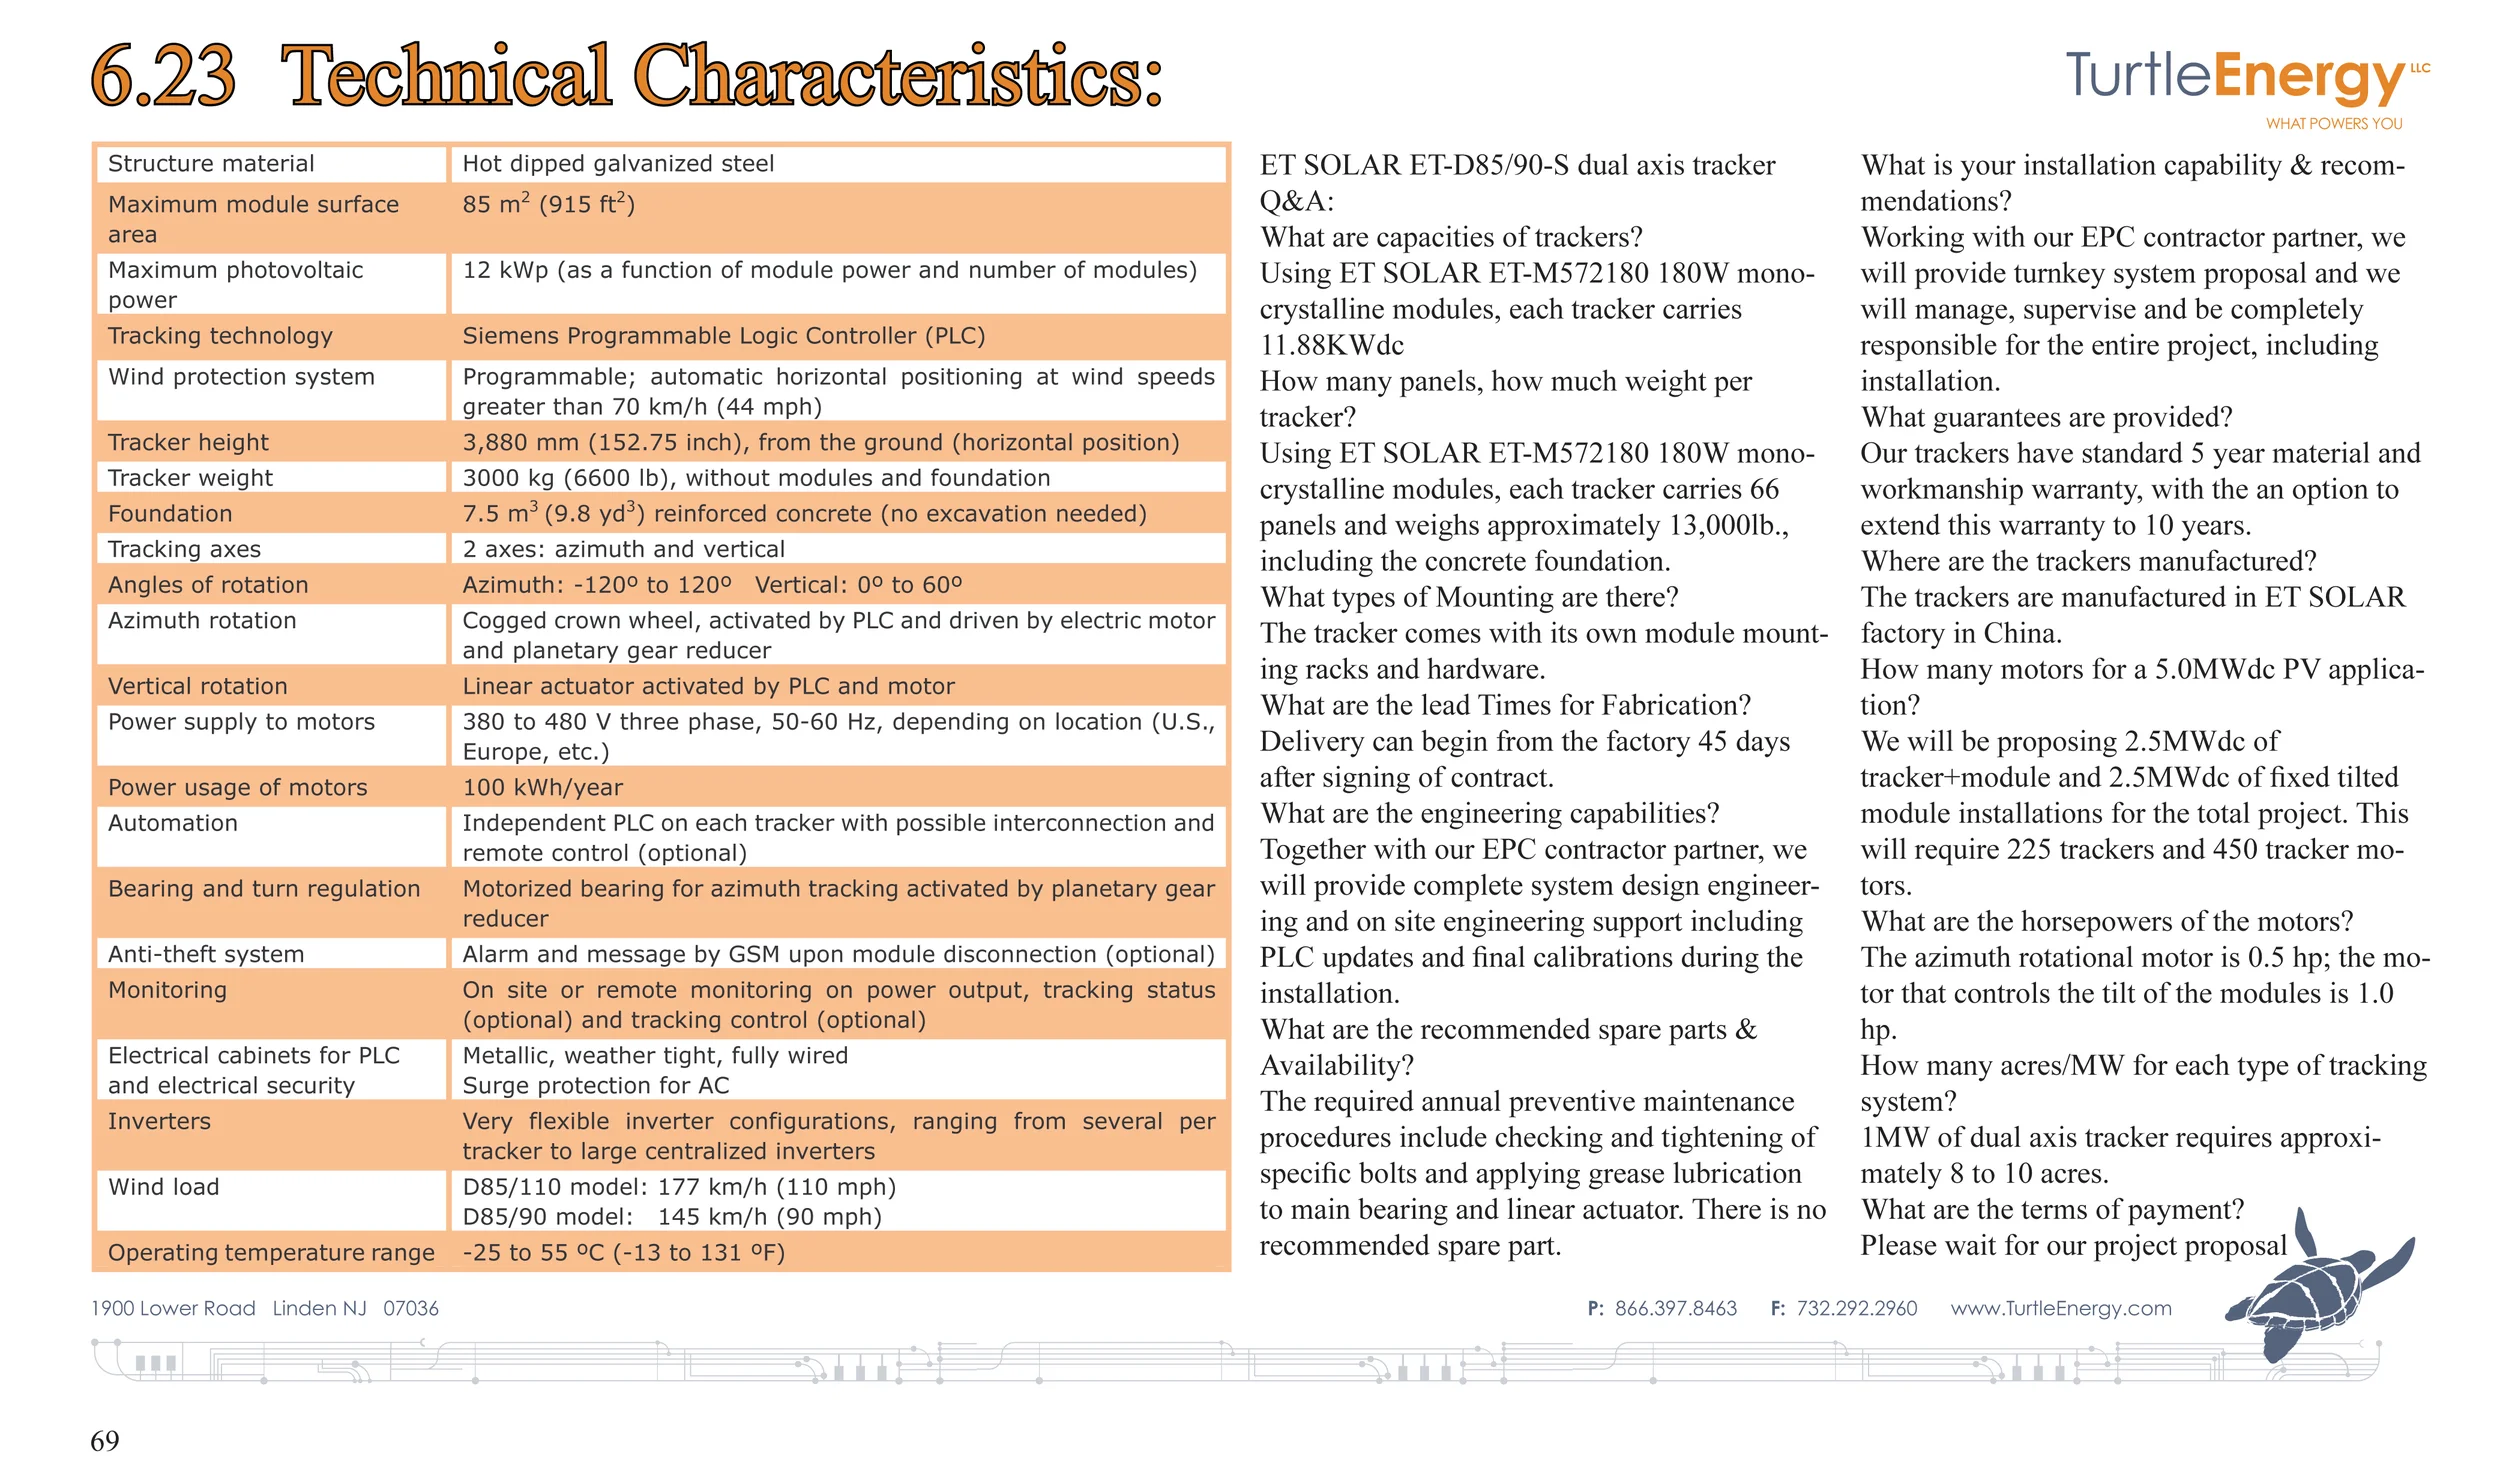
Figure 15: Dual Axis Trackers rotate to follow the azimuth angle of the sun, tilt to follow the altitude of the sun.
This 2 axis tracker by Solon, called "Mover" is truly one of the solar industries most innovative products because the manufacturer assembles and wires all power systems, telemetry, bracktry and concrete in the factory so that the unit arrives on the back of a truck with pick points for a crane to lift the unit into place on site. The array unfolds and locks into a 3X4 module plane.
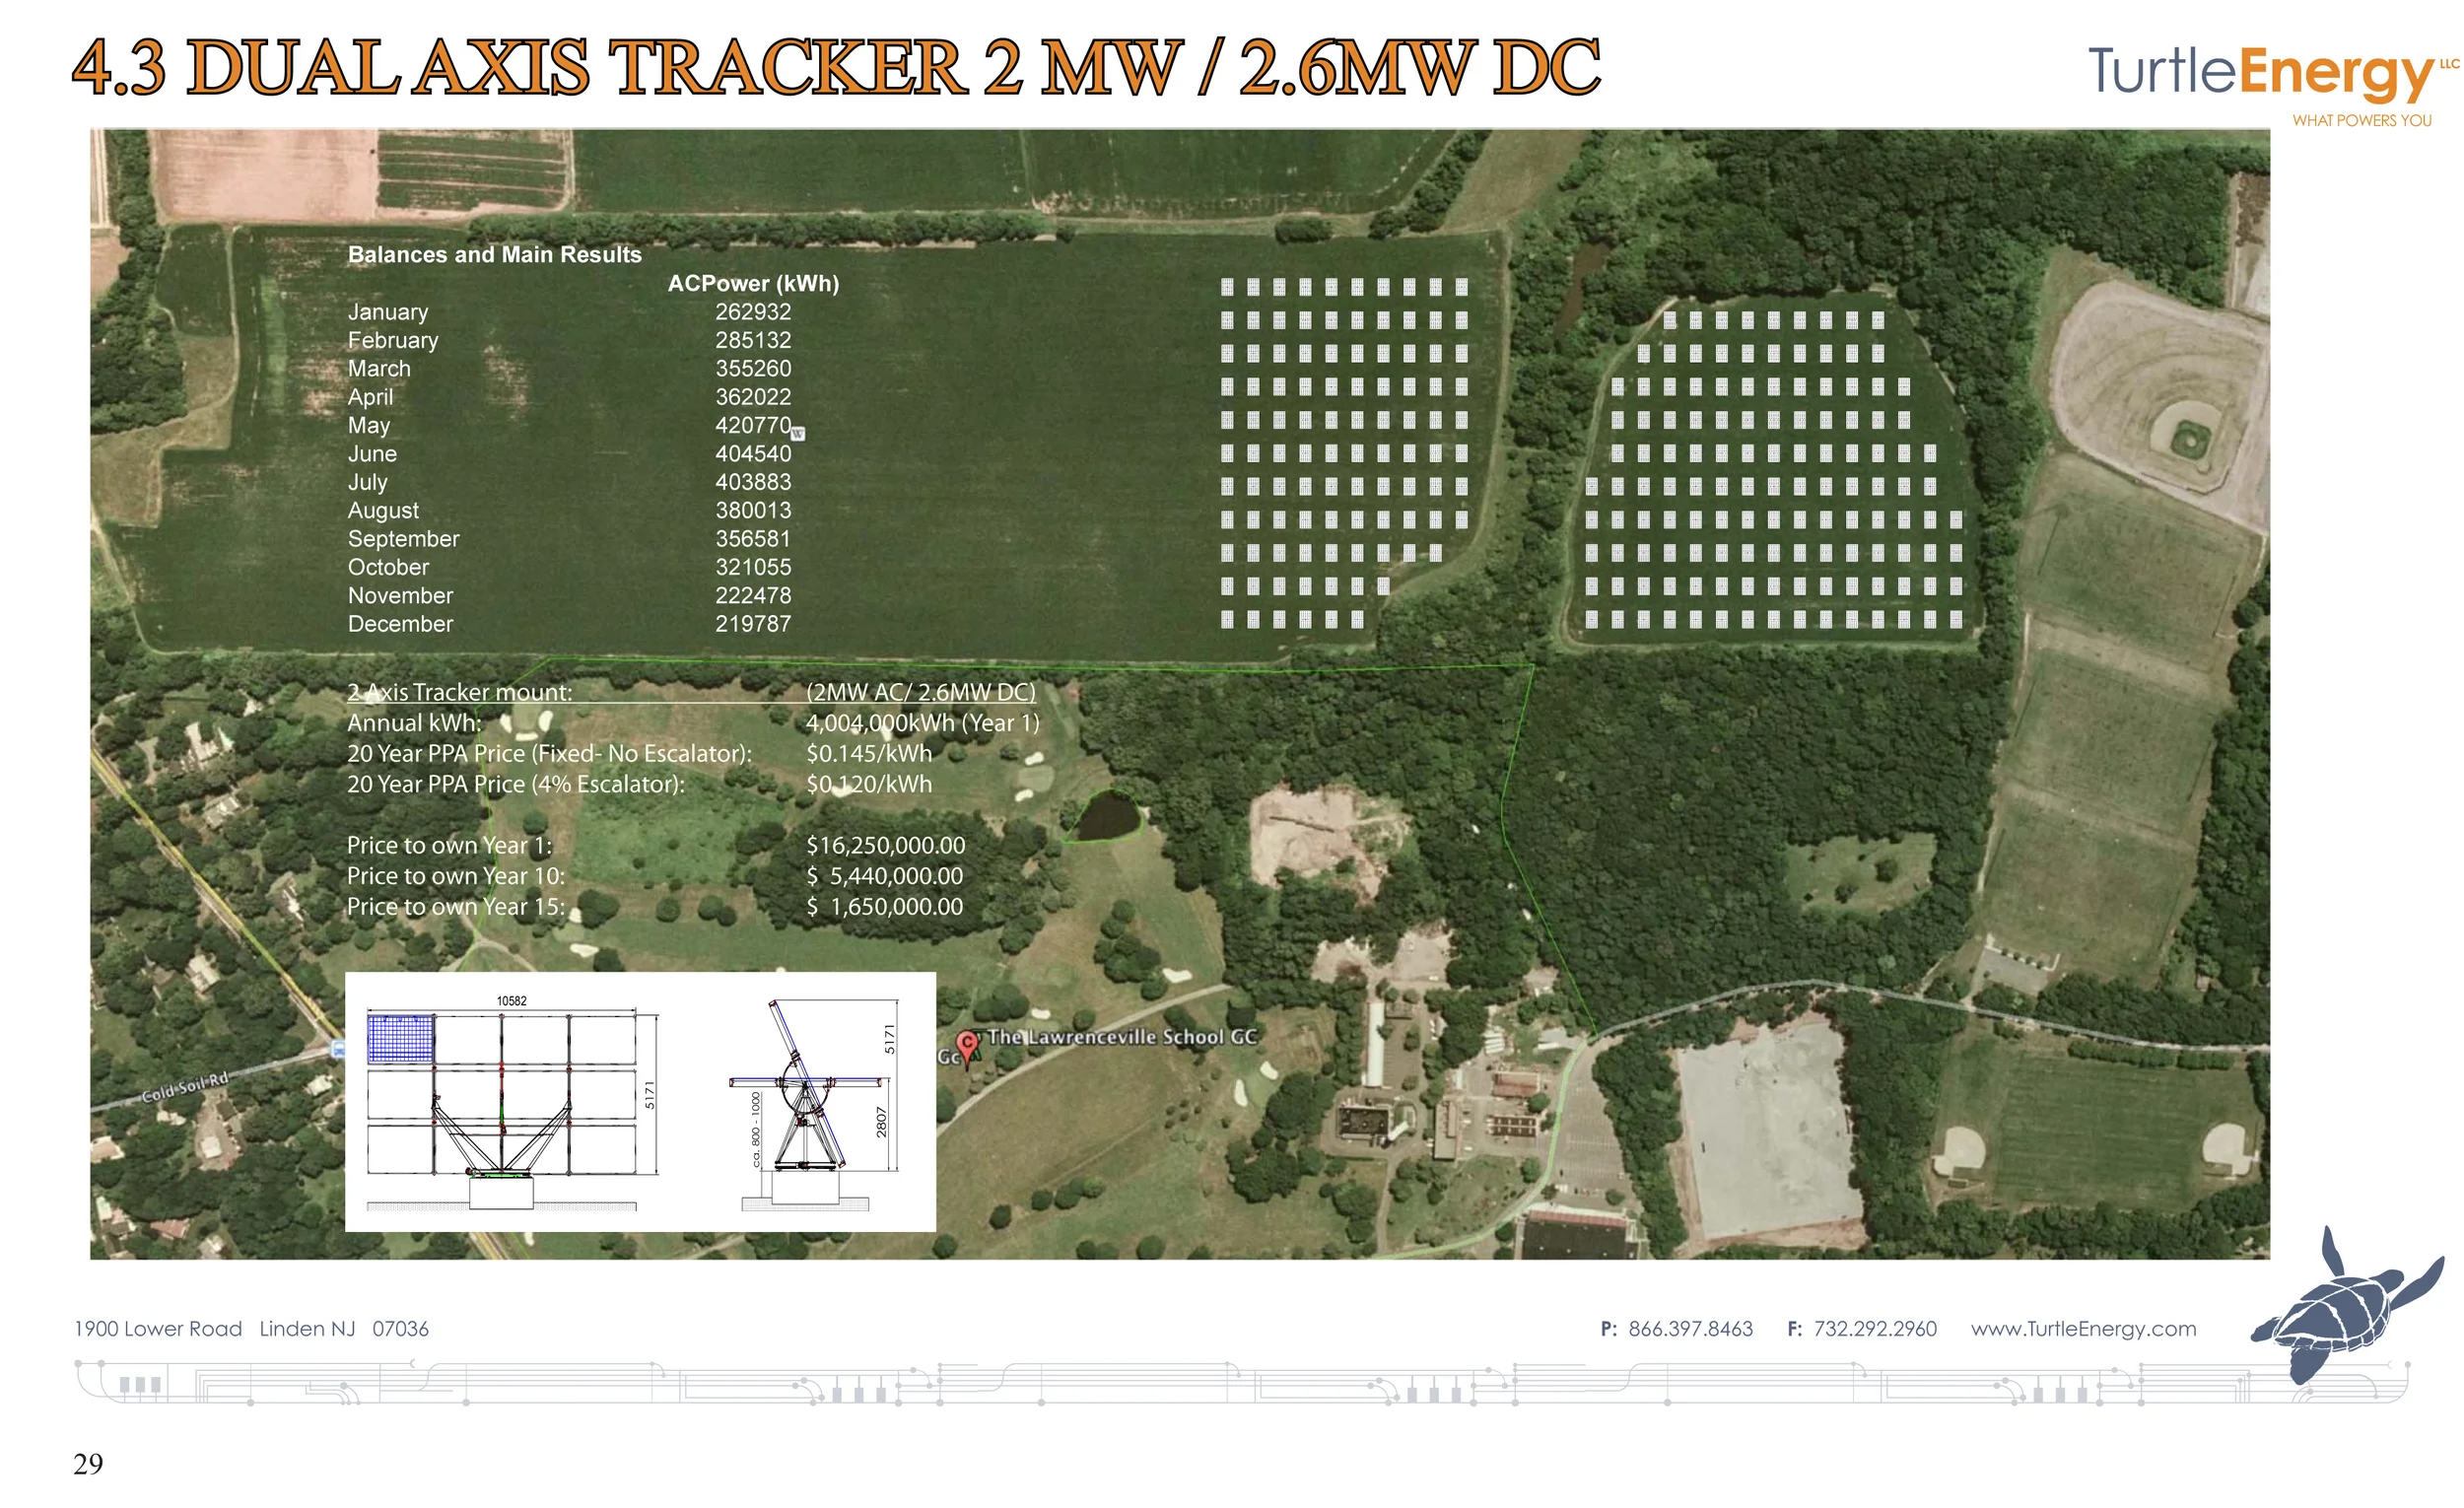
Figure 16: Dual Axis Trackers require the most space but produce the most MWh per KW of solar module.
2 axis trackers are most vulnerable to shading each other in the early morning hours and in the late afternoon hours. For this reason, they require a great deal of space in order to defend against this deleterious effect on electricity production. In the winter, when the altitude of the sun is lower, fixed tilt systems produce significantly less electricity. 2 axis trackers are able to produce up to 10X more electricity than a 5 degree fixed tilt system so long as they have an unobstructed view of the sun.

Figure 17: Option two allowed for a conservative remainder of utility sourced electricity, which a lender would have a say over in order to reduce risk of over-supply.
With a very large energy user, such as The Lawrenceville School– future conservation measures taken on campus. could significantly reduce energy demand and risk oversupply of solar power.

Figure 18: Fixed tilt solar power mounting structures can be founded upon precast concrete ballast that is delivered to the site and placed above ground.
Given the geotechnical risk at the Lawrenceville agricultural site, self ballasted fixed tilt

Figure 19: separation of the sun farm into two different fields was a weak solution.
The wetland that separated the two Fields in this scheme is a divisive element that increases permitting risk and creates a logistical liability for the construction potentially increasing cost of the project. However, this option was presented as a solution that minimized the amount of agricultural land that was used by the sun farm.
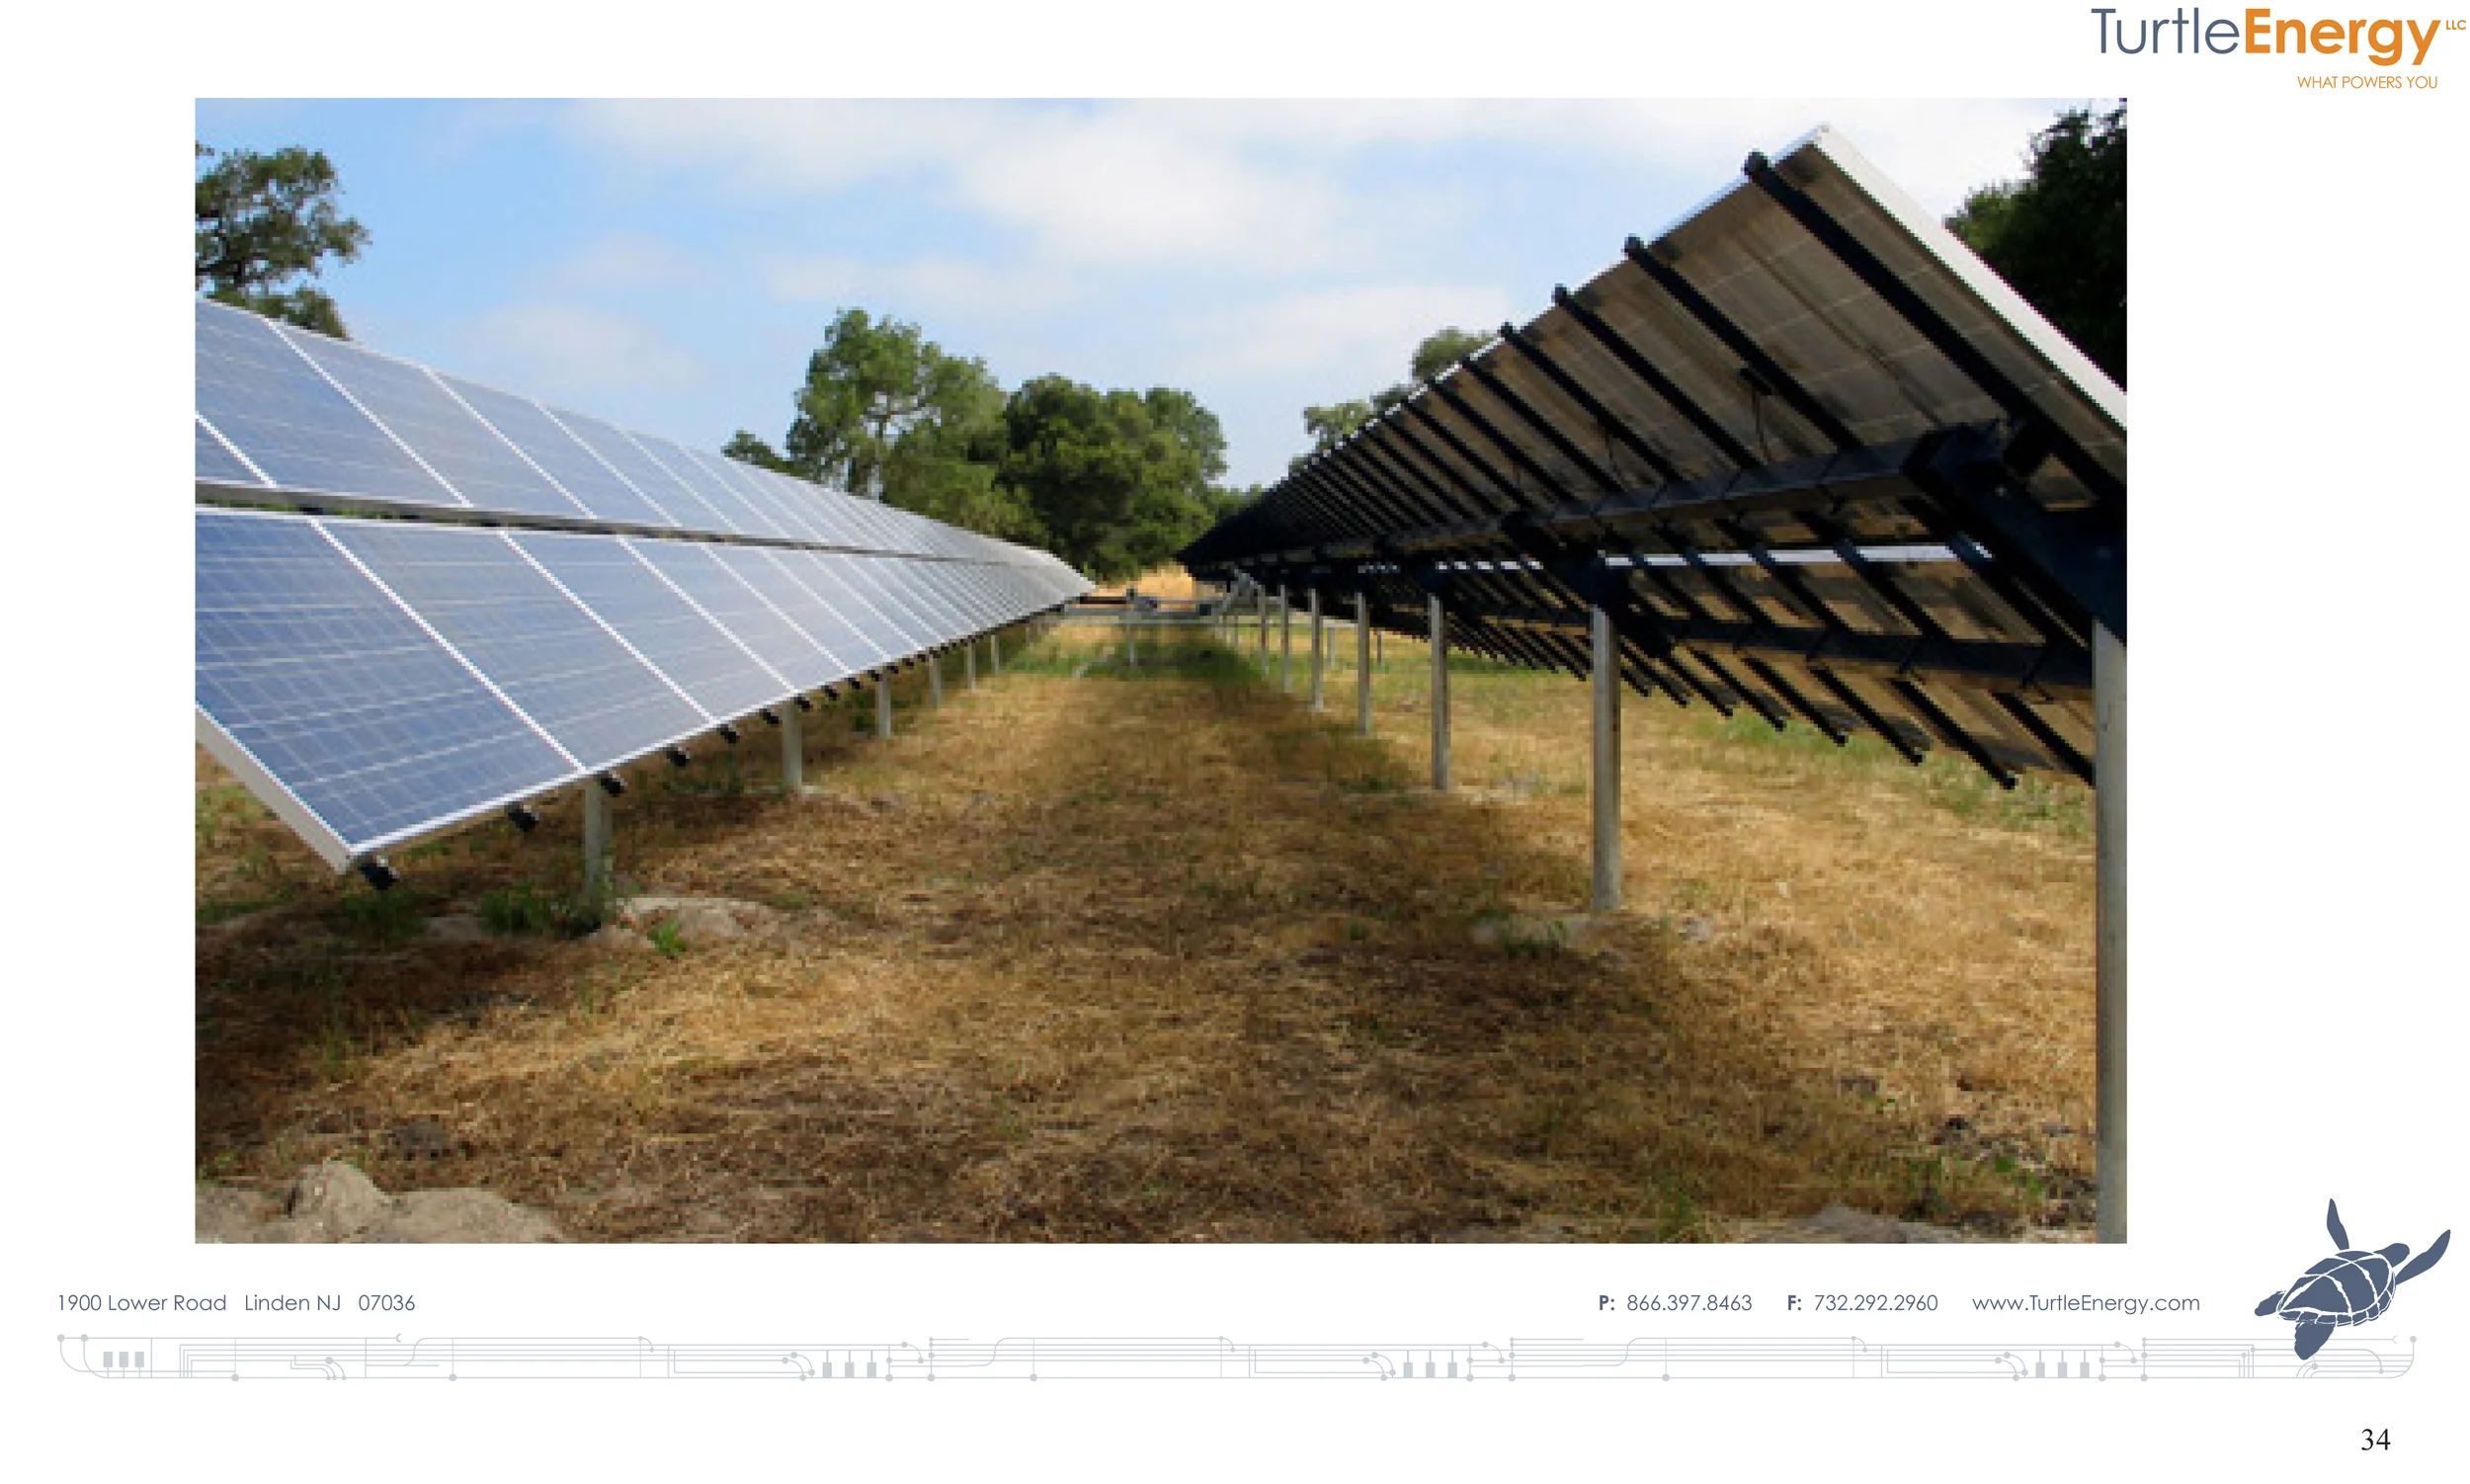
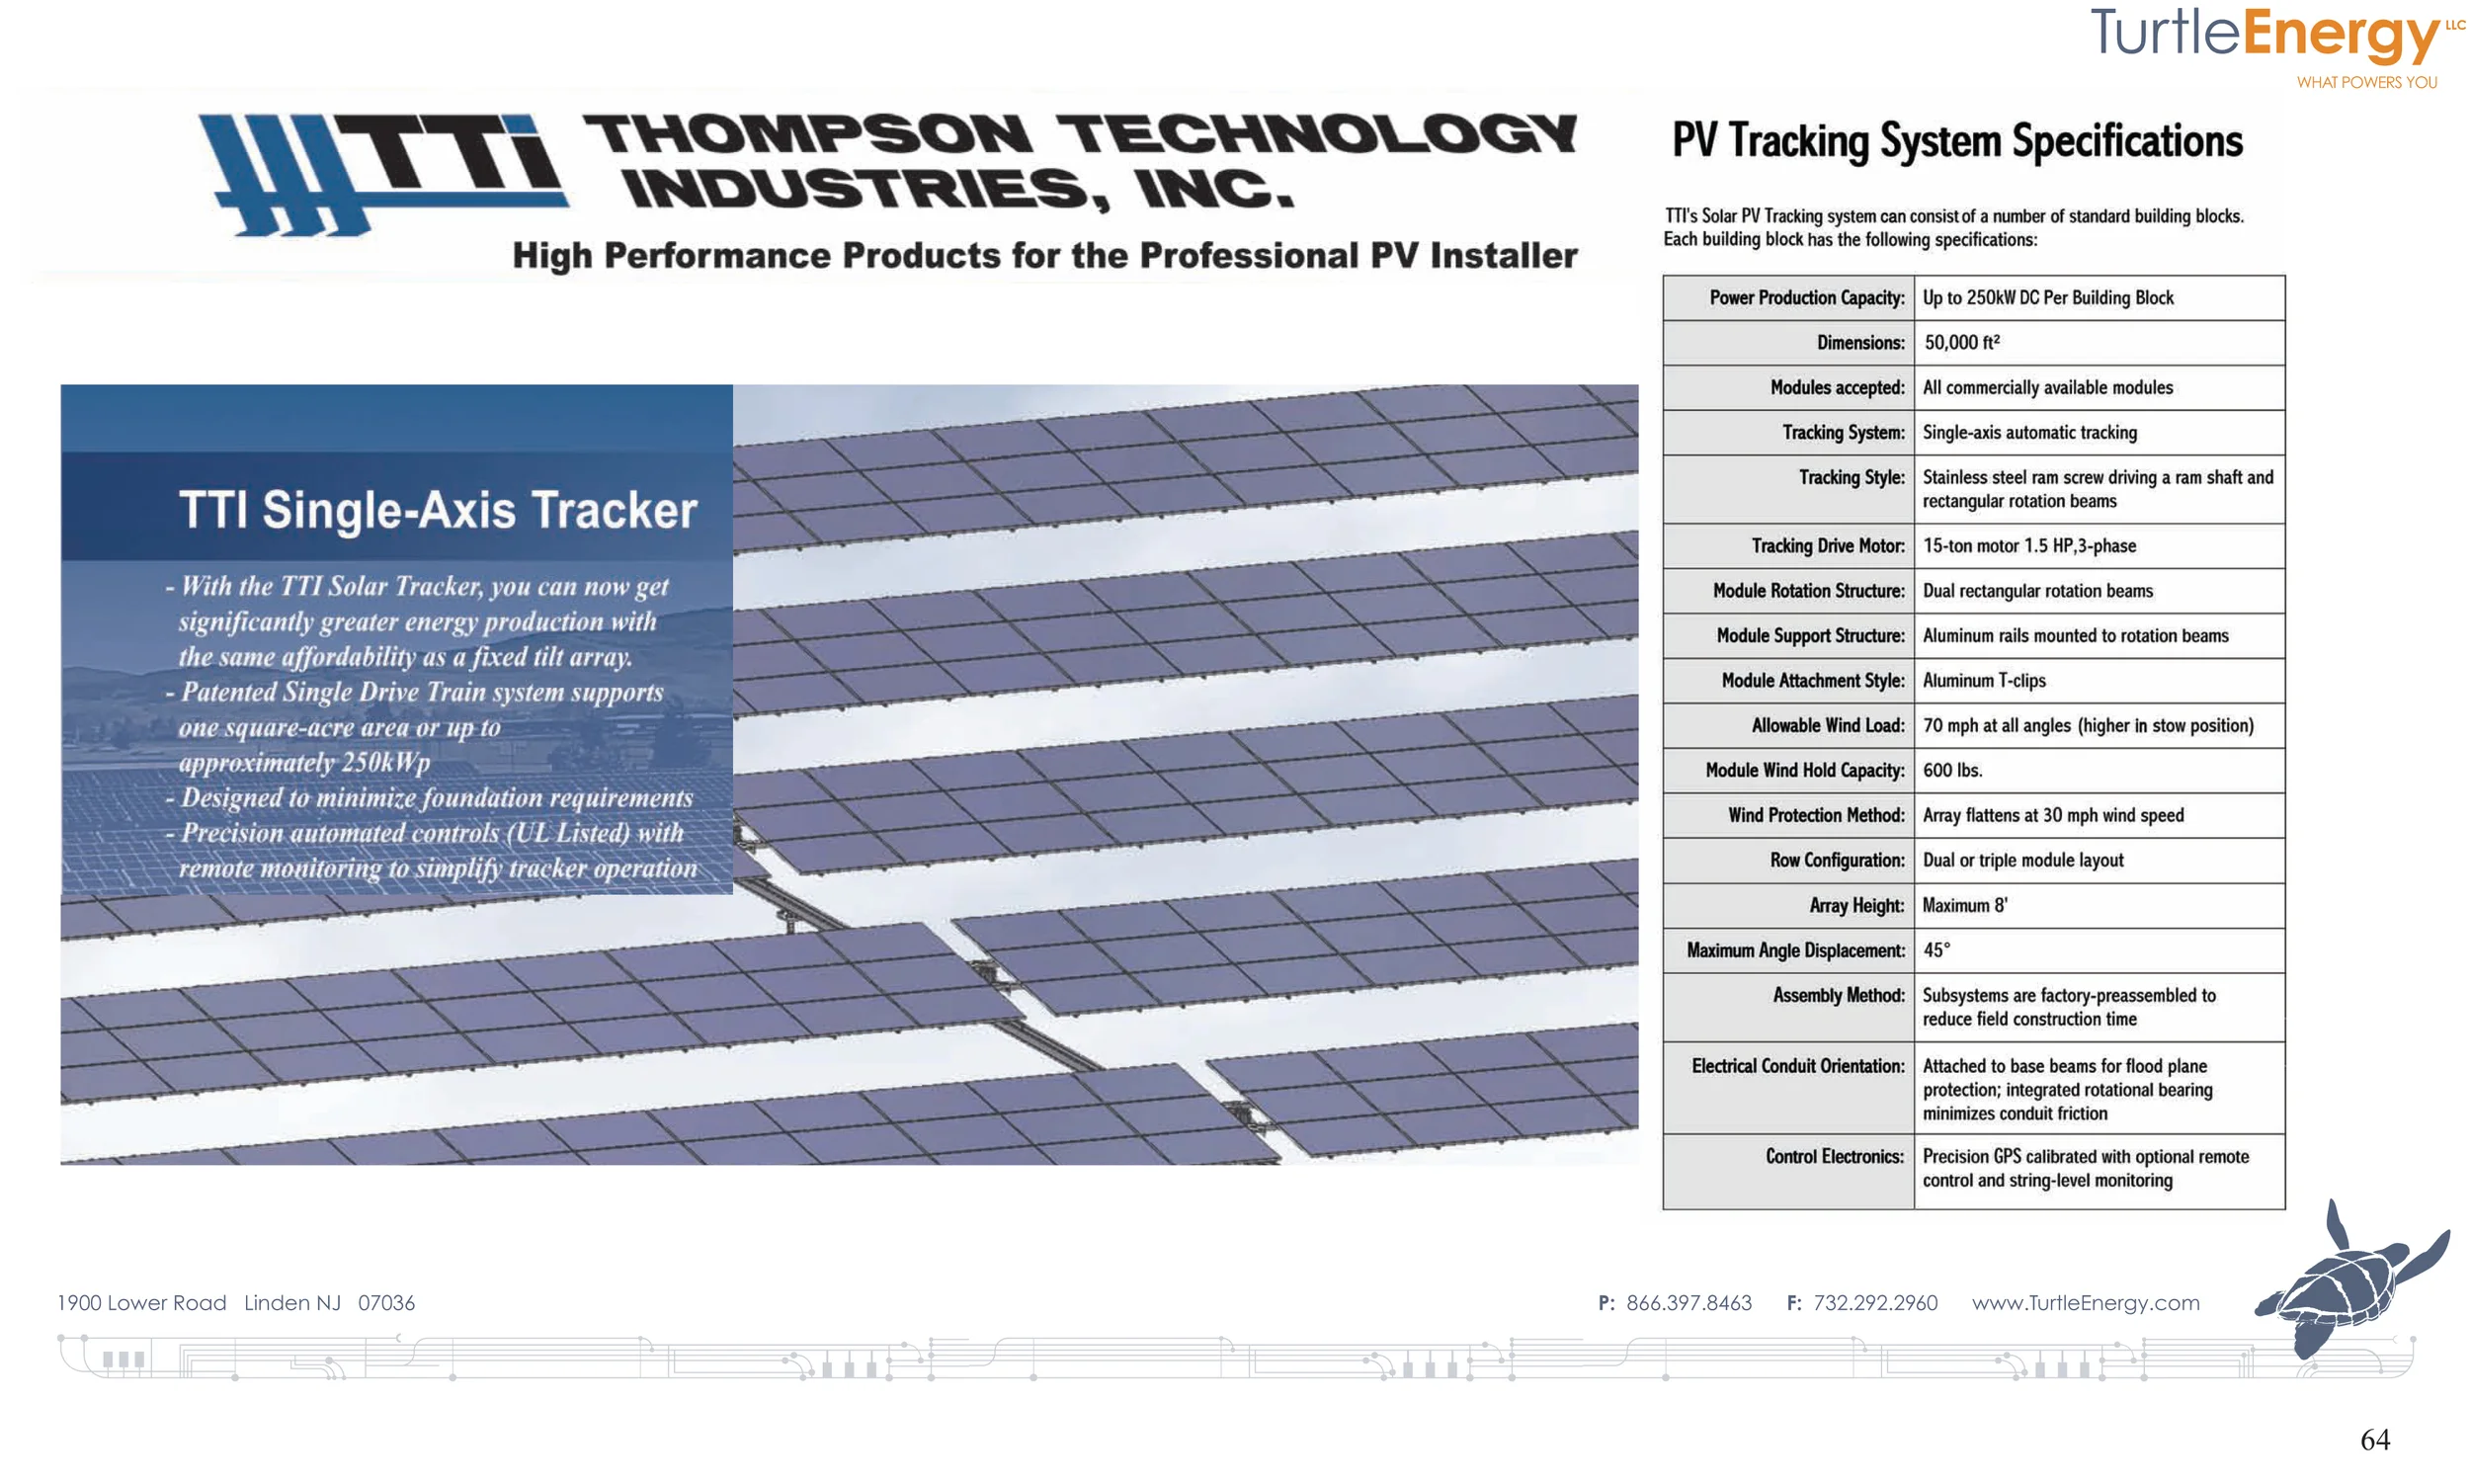
Figure 20: The Thompson Technology "Sun Seeker" single axis tracker with two modules mounted in landscape orientation.
This single axis tracker was popular with project developers on the West Coast during the 2007 2008 timeframe. The advantage of this tracker was the high ratio of DC Watts per pier. Because this tracker has two modules mounted in landscape format there is a significant increase in power per unit of foundation. Ultimately however, this project elected to use alternate single axis tracker which deployed a single module in portrait orientation.
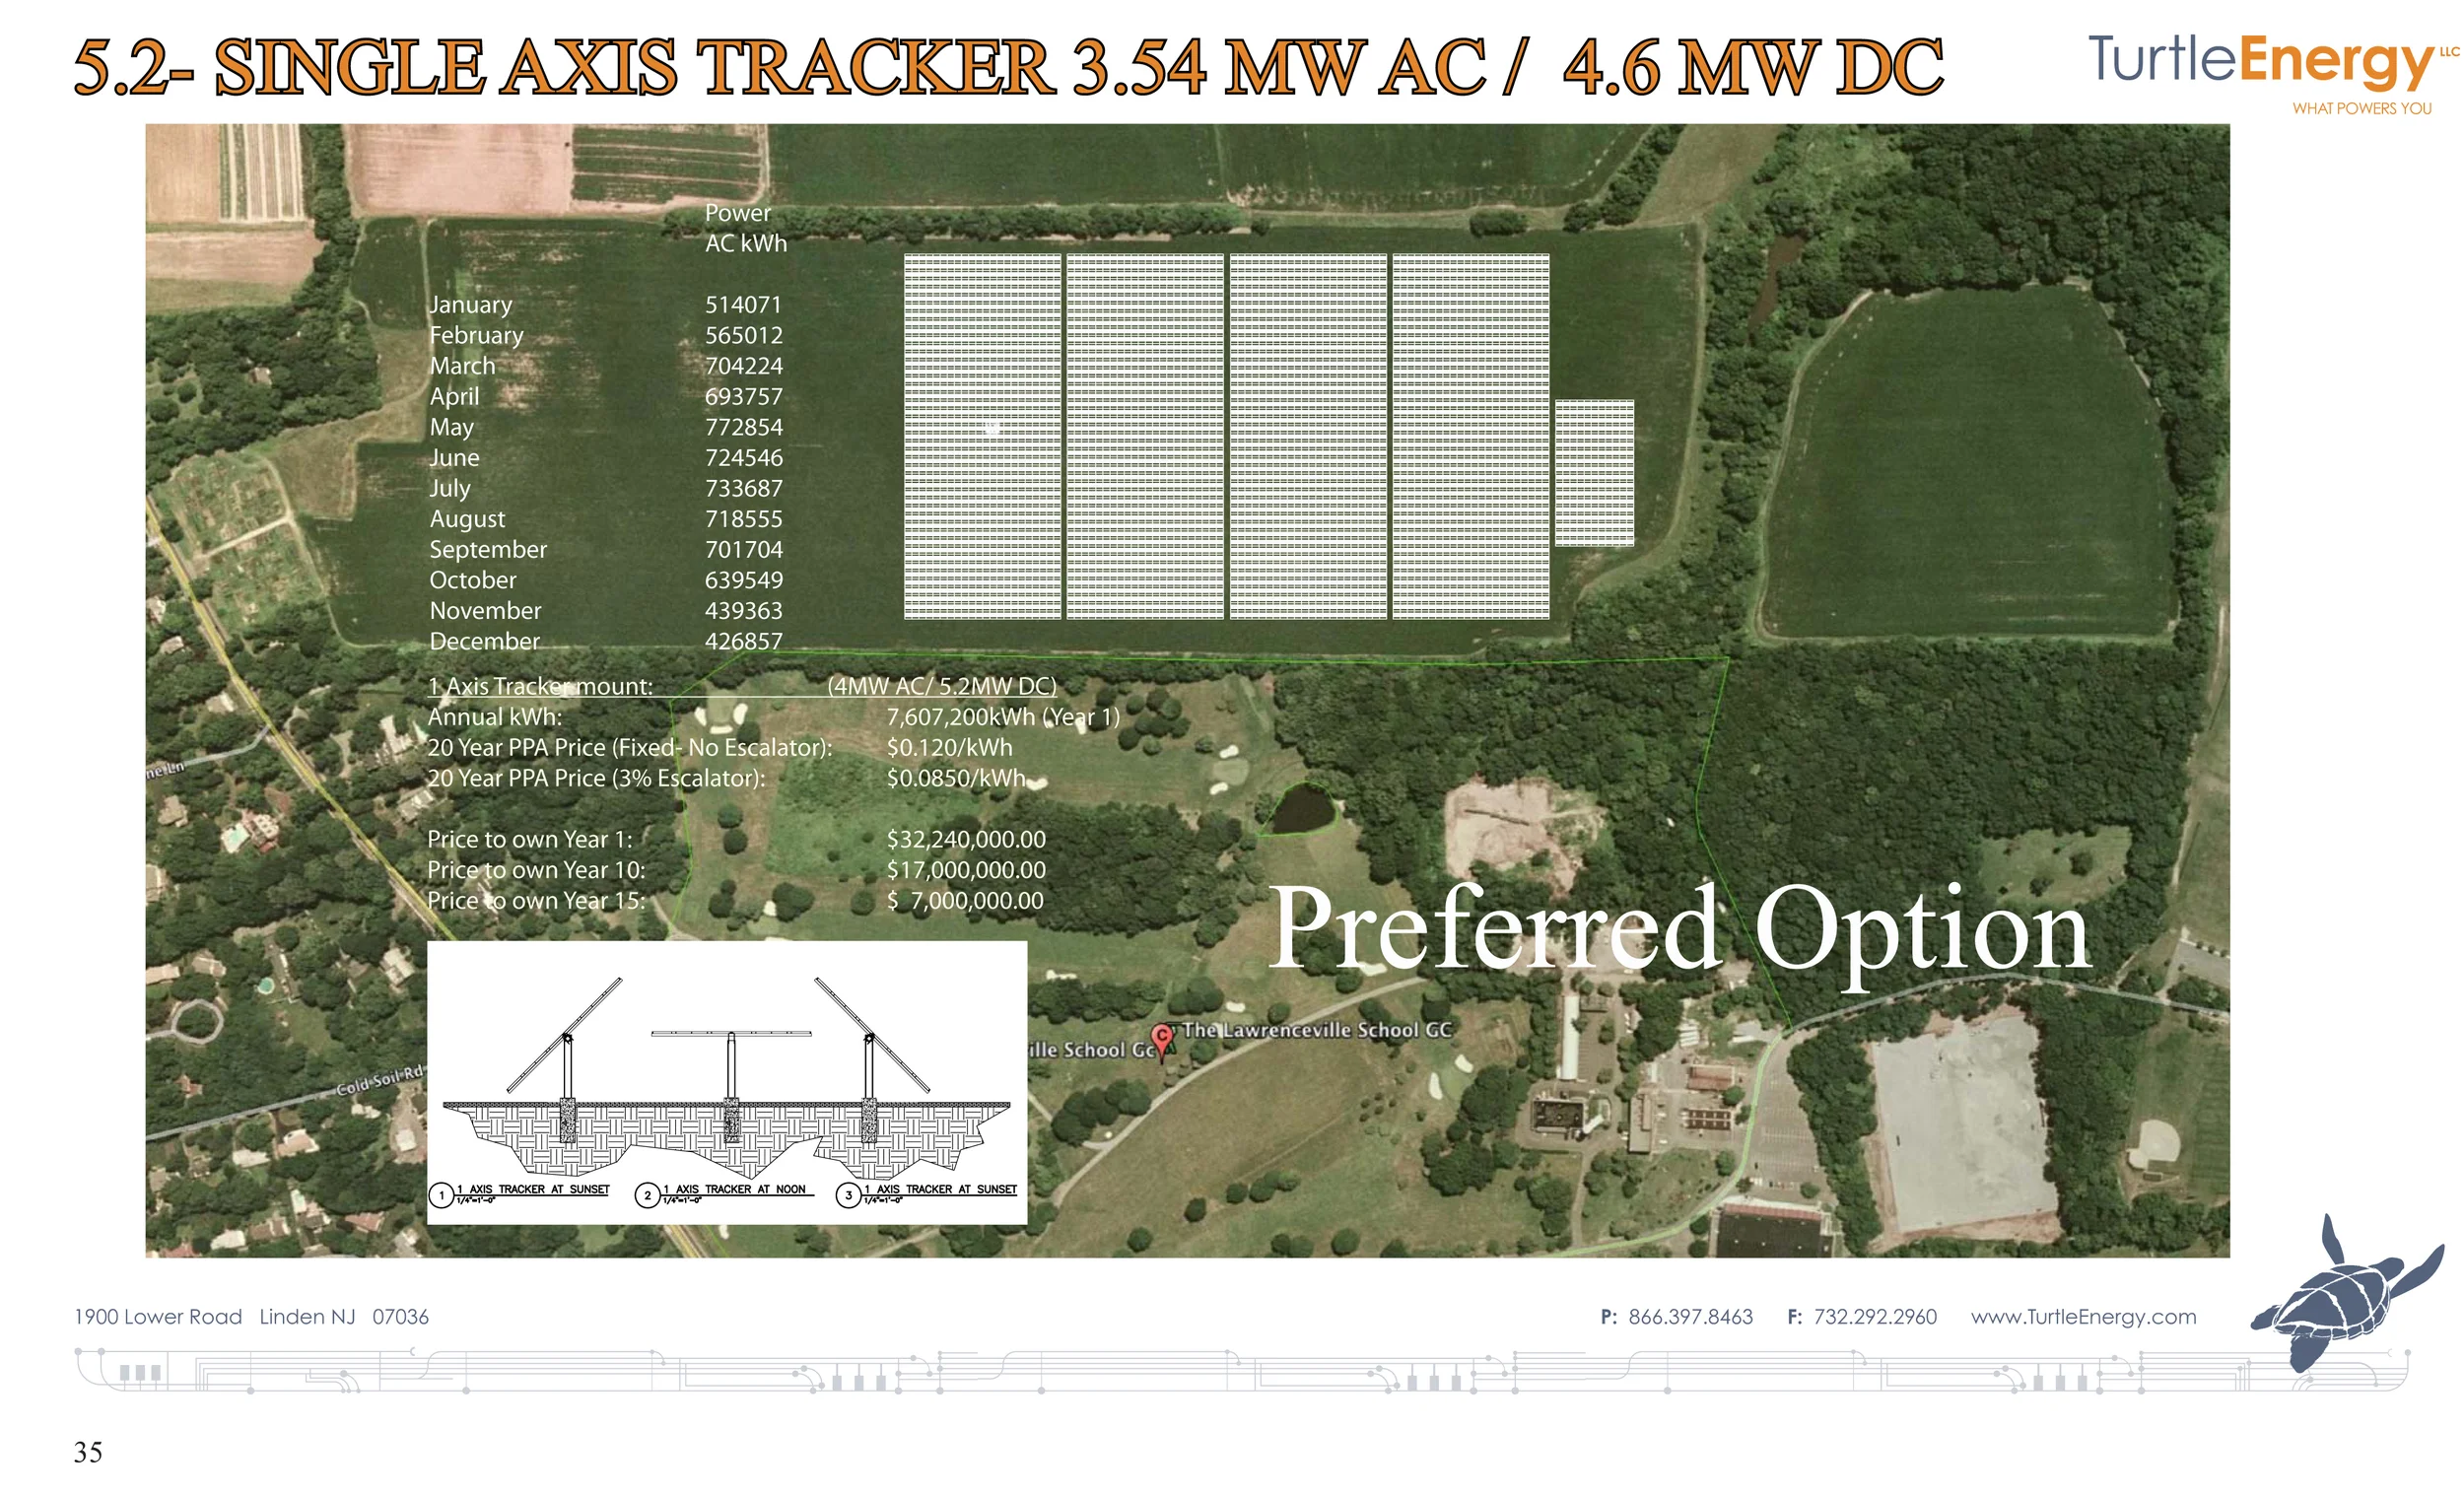
Figure 21: the preferred option–this single axis tracker layouts approximates the layout of the constructed solution.
Be constructed solution which deployed an alternate single axis tracker occupies slightly more land that is shown in this
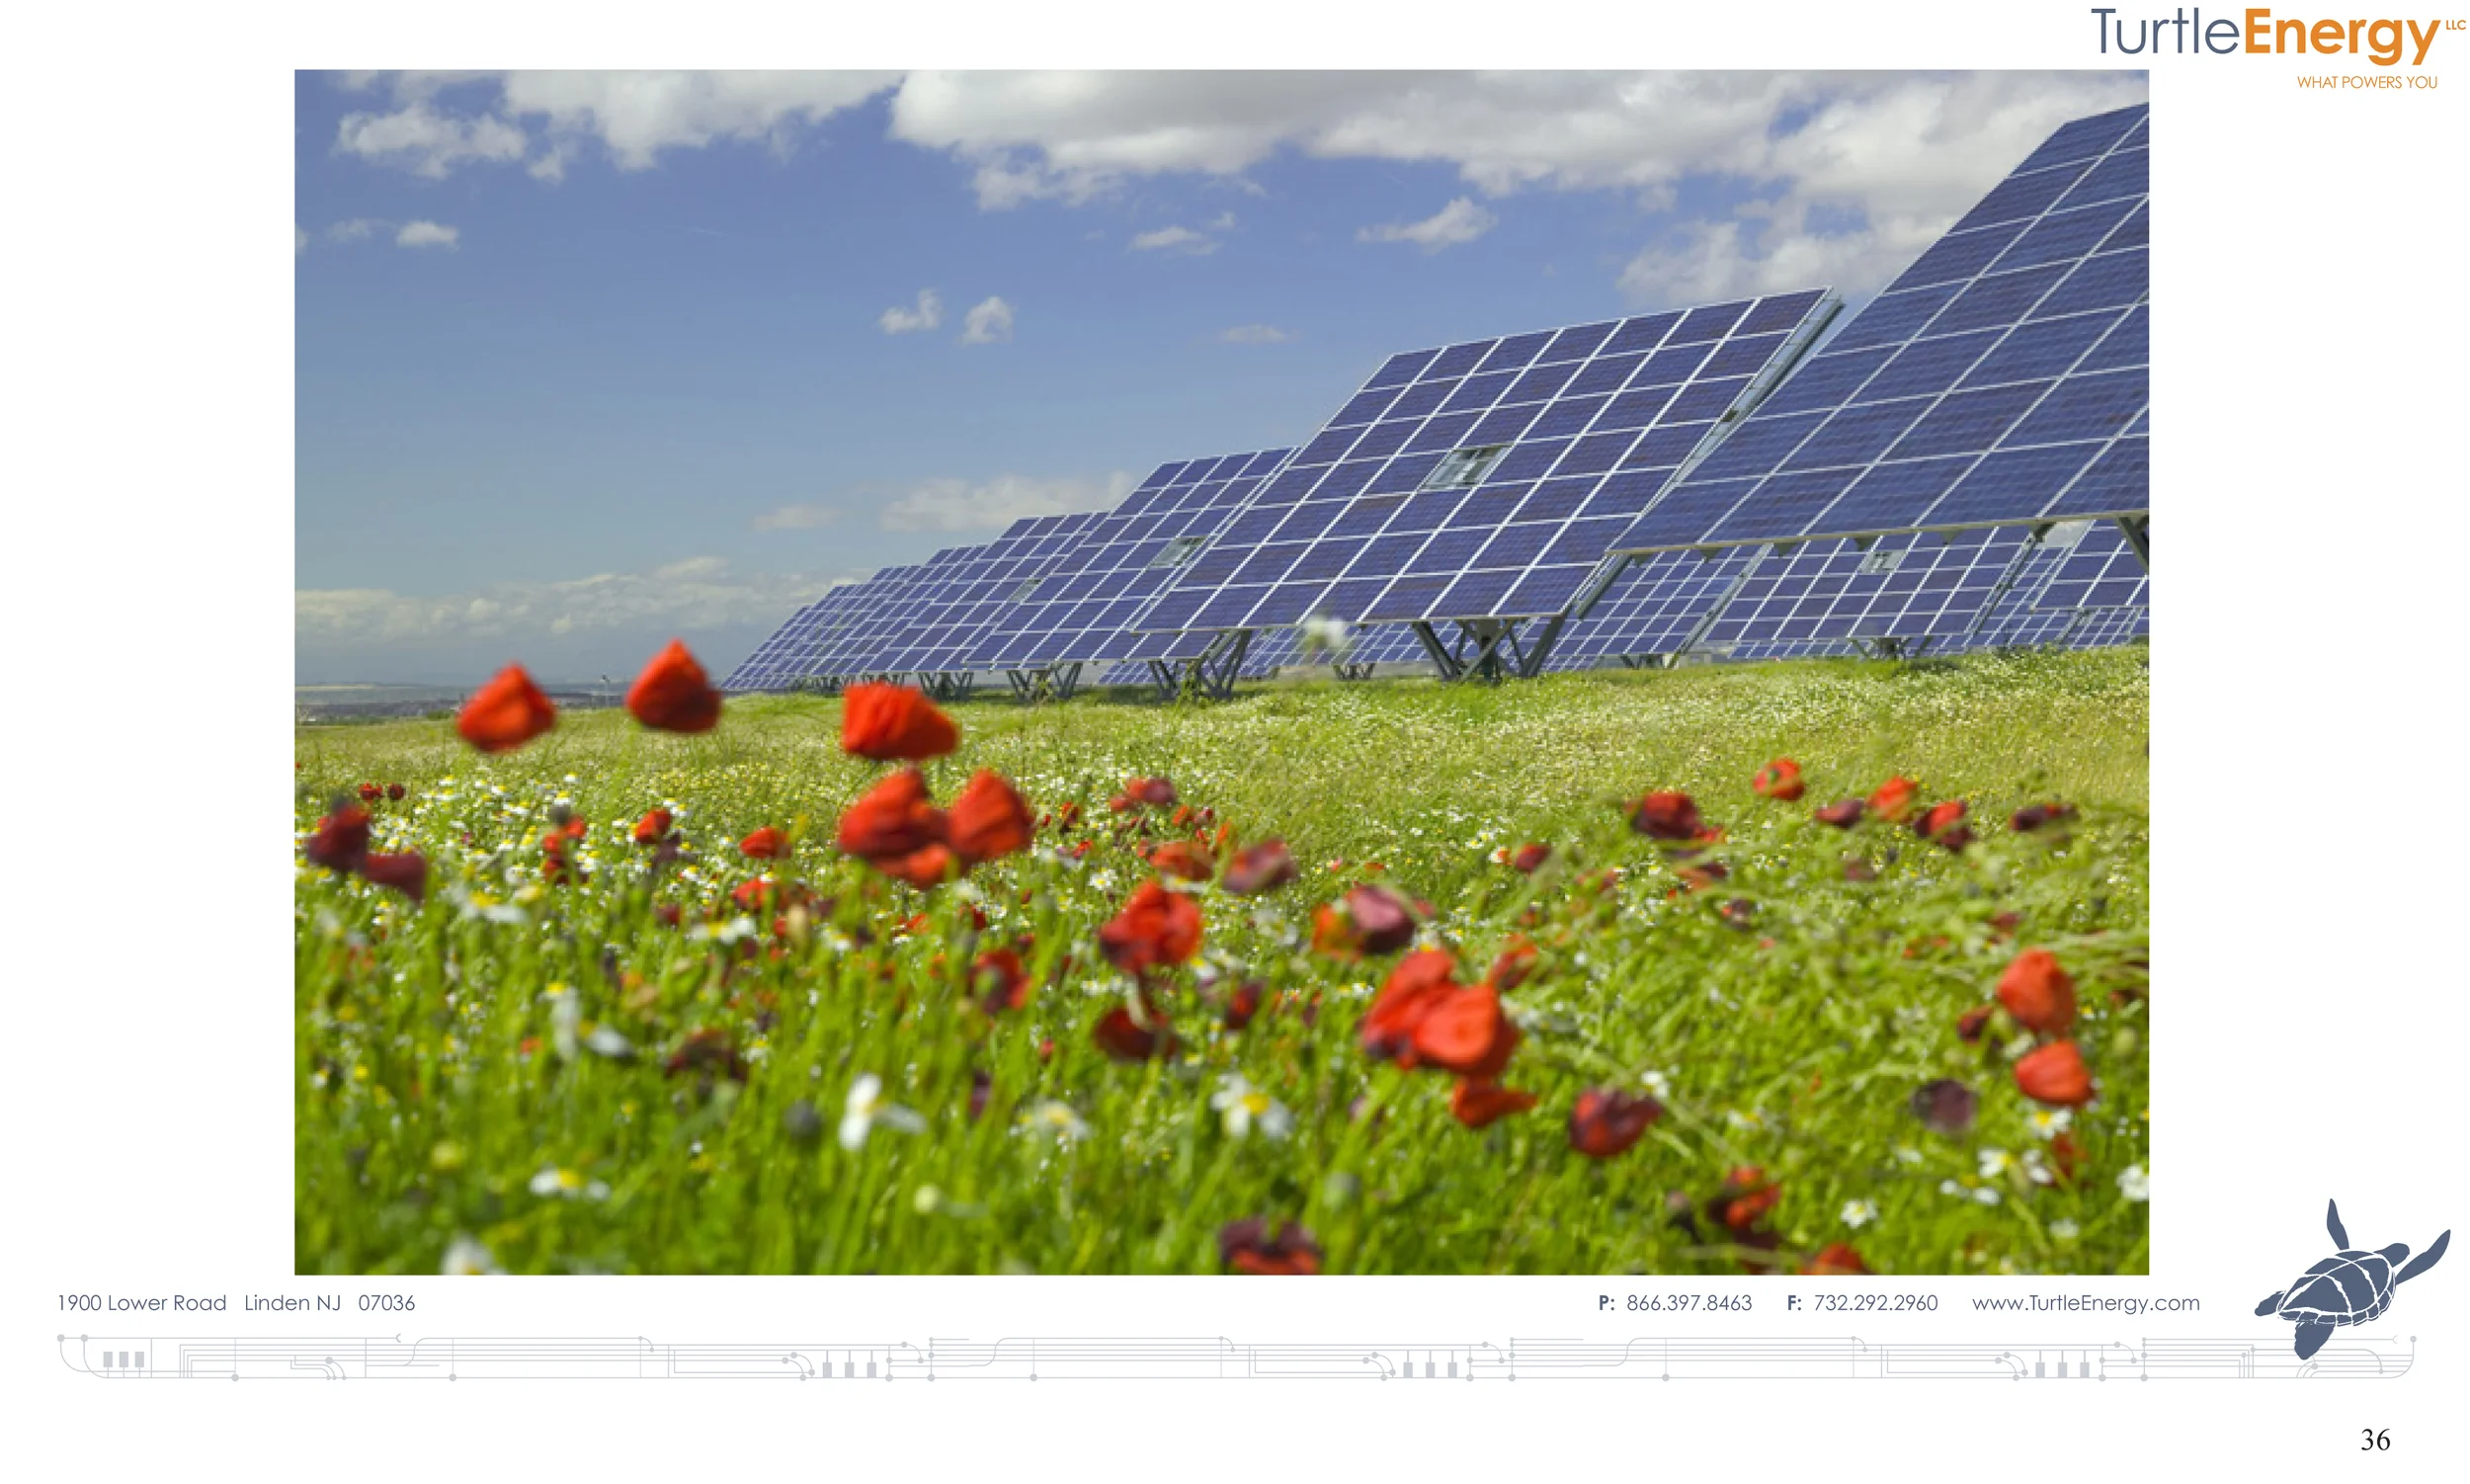
Figure 22: Dual axis trackers–they produce twice as much energy as a fixed tilt module and use twice as much space.
Dual axis trackers require a ground coverage ratio that will address their vulnerability to self shading. When spaced sufficiently far apart from each other, dual axis trackers Will follow the altitude and the azimuth of the sun over the course of the entire day, generating significantly more electricity that a south facing fixed tilt solar panel.
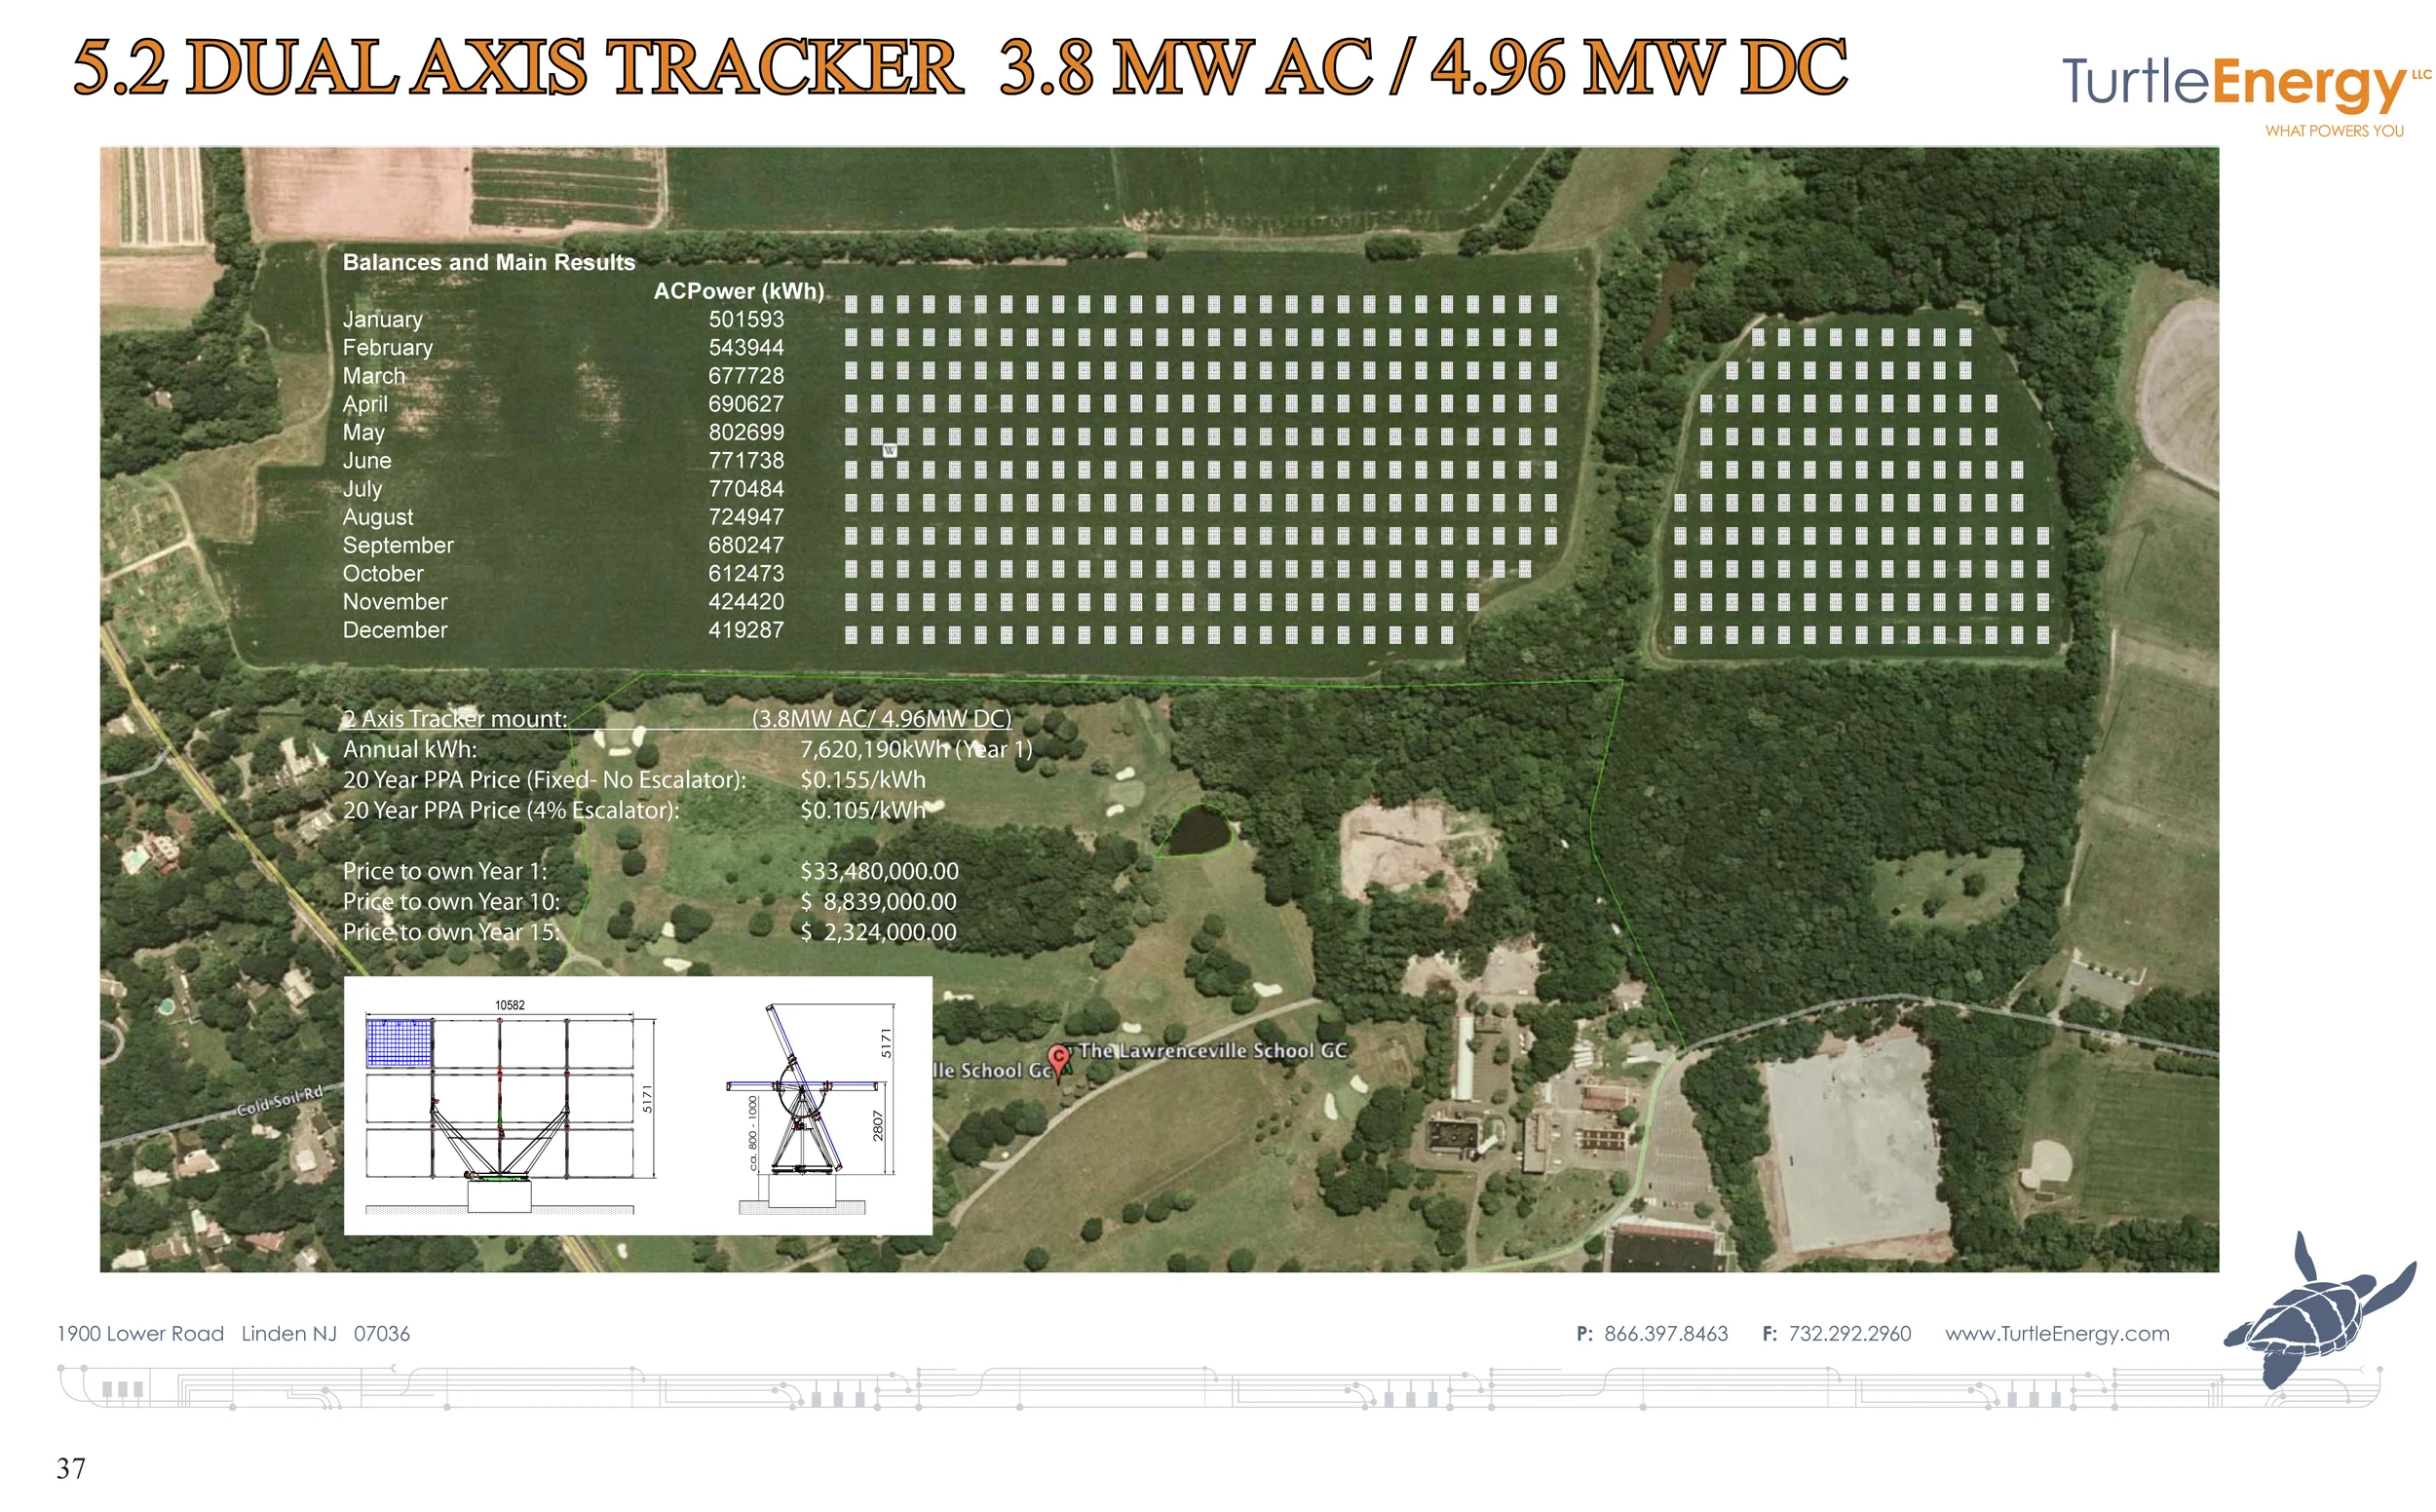
Figure 23: As can be seen in the diagram above, dual axis trackers occupy a premium amount of Space.
Despite the increased amount of space that a dual axis tracker occupies, the residual space between the trackers allows for continued agricultural use of the land.

Figure 24: There was a need to explain the wildly raging performance of the different options.
The same photovoltaic module will perform differently depending upon the design of the mounting structure that supports it in the sun.
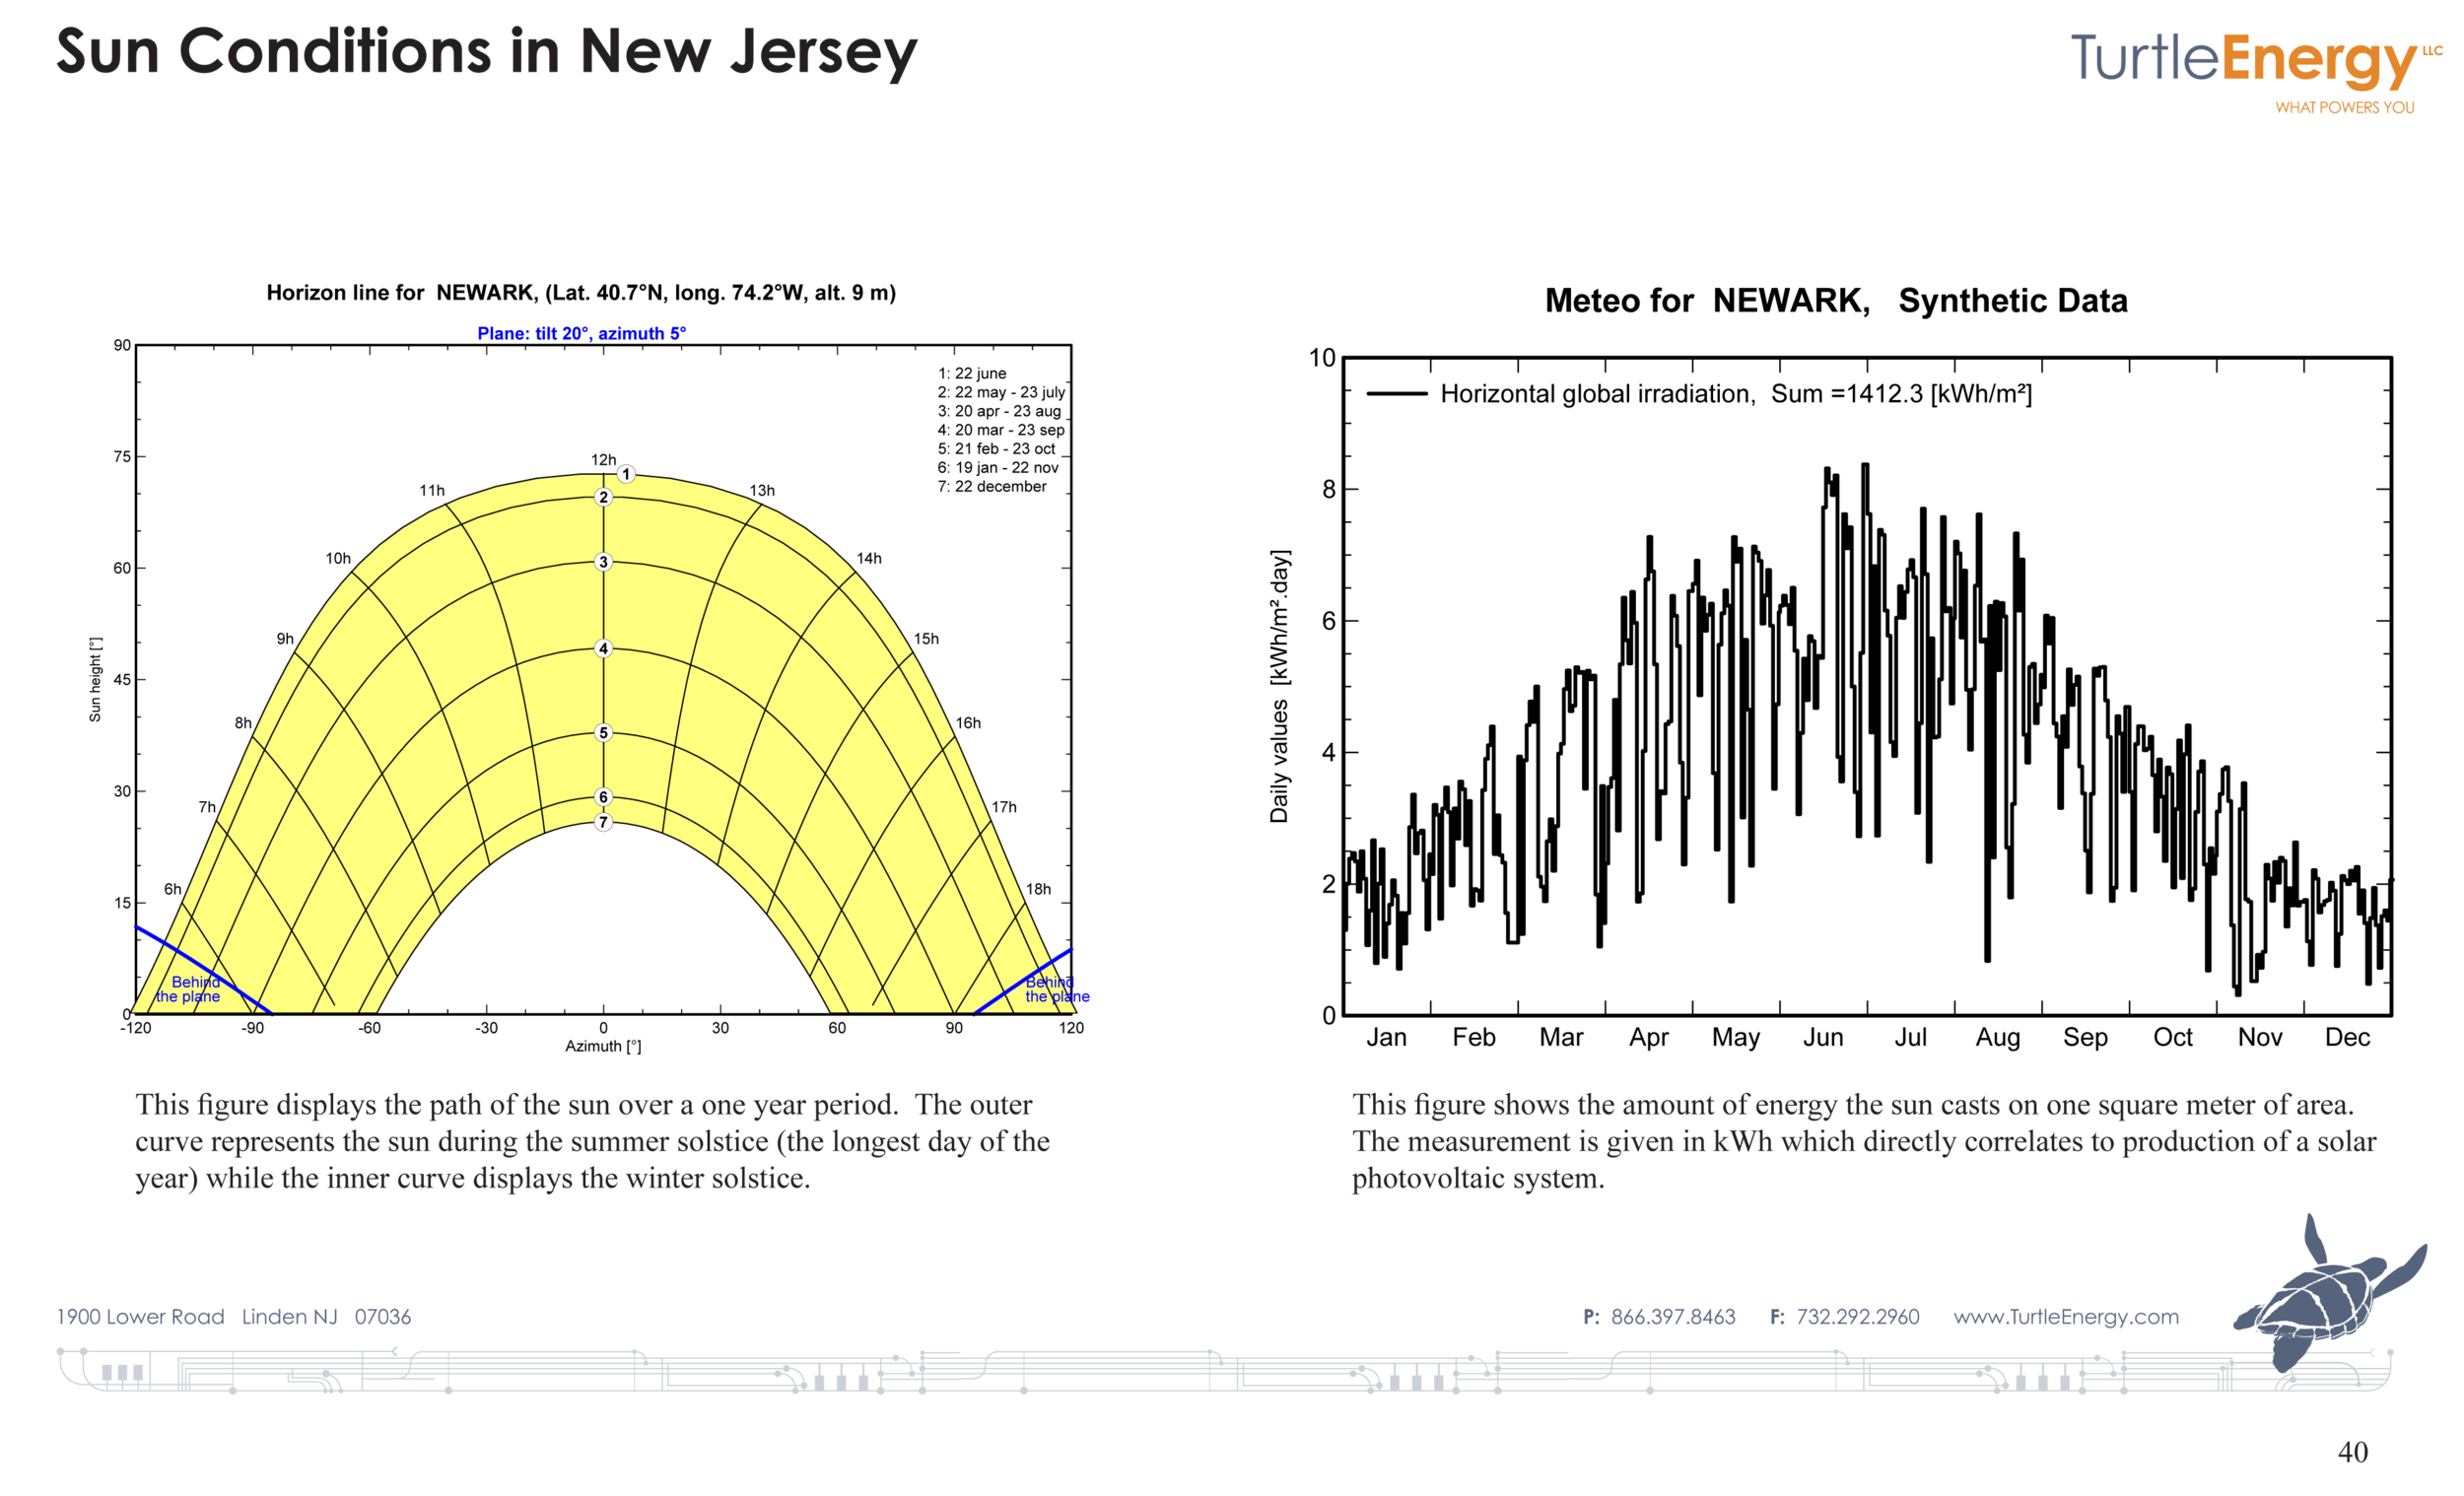
Figure 25: The increased sunshine and length of daylight time in the summer accounts for a significant increase in energy compared to the winter months.
For this reason, some system designers bias the orientation of their solar modules to a shallow tilt and tolerate a certain amount of wintertime shading because of the dramatic difference in conditions seasonally.
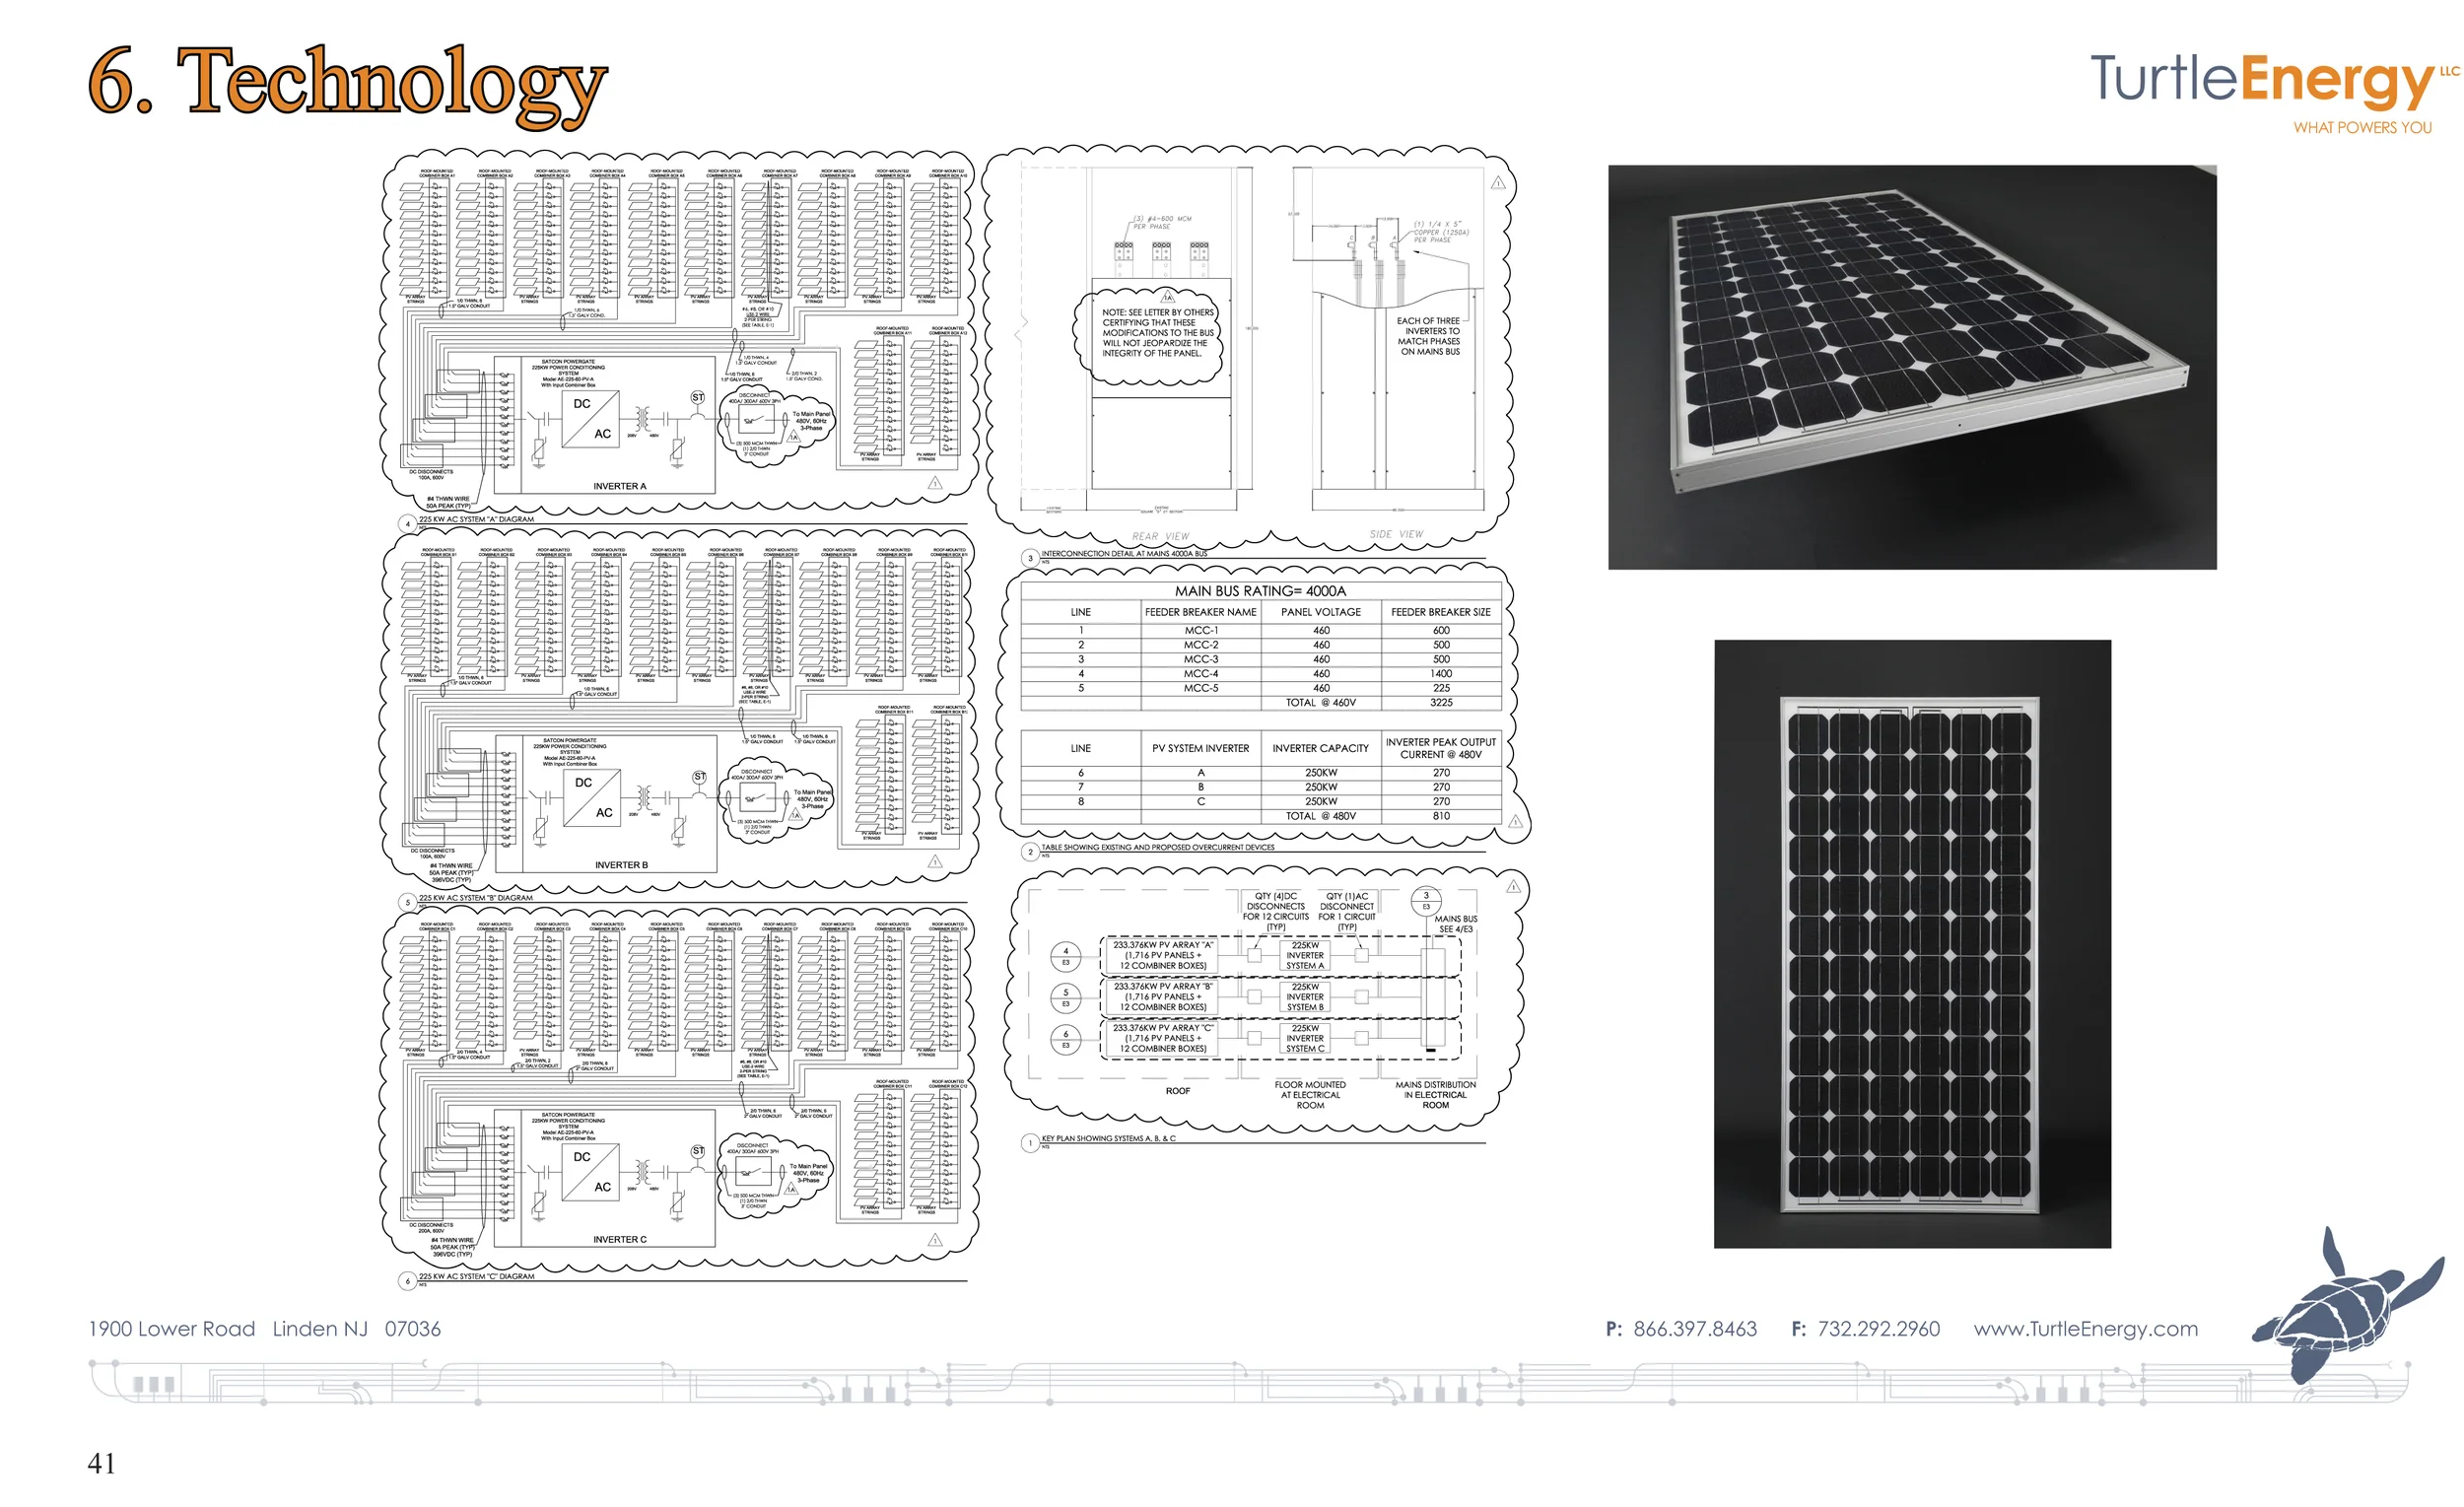
Figure 26: At the time of the project design, the availability of monocrystalline solar modules was very good.
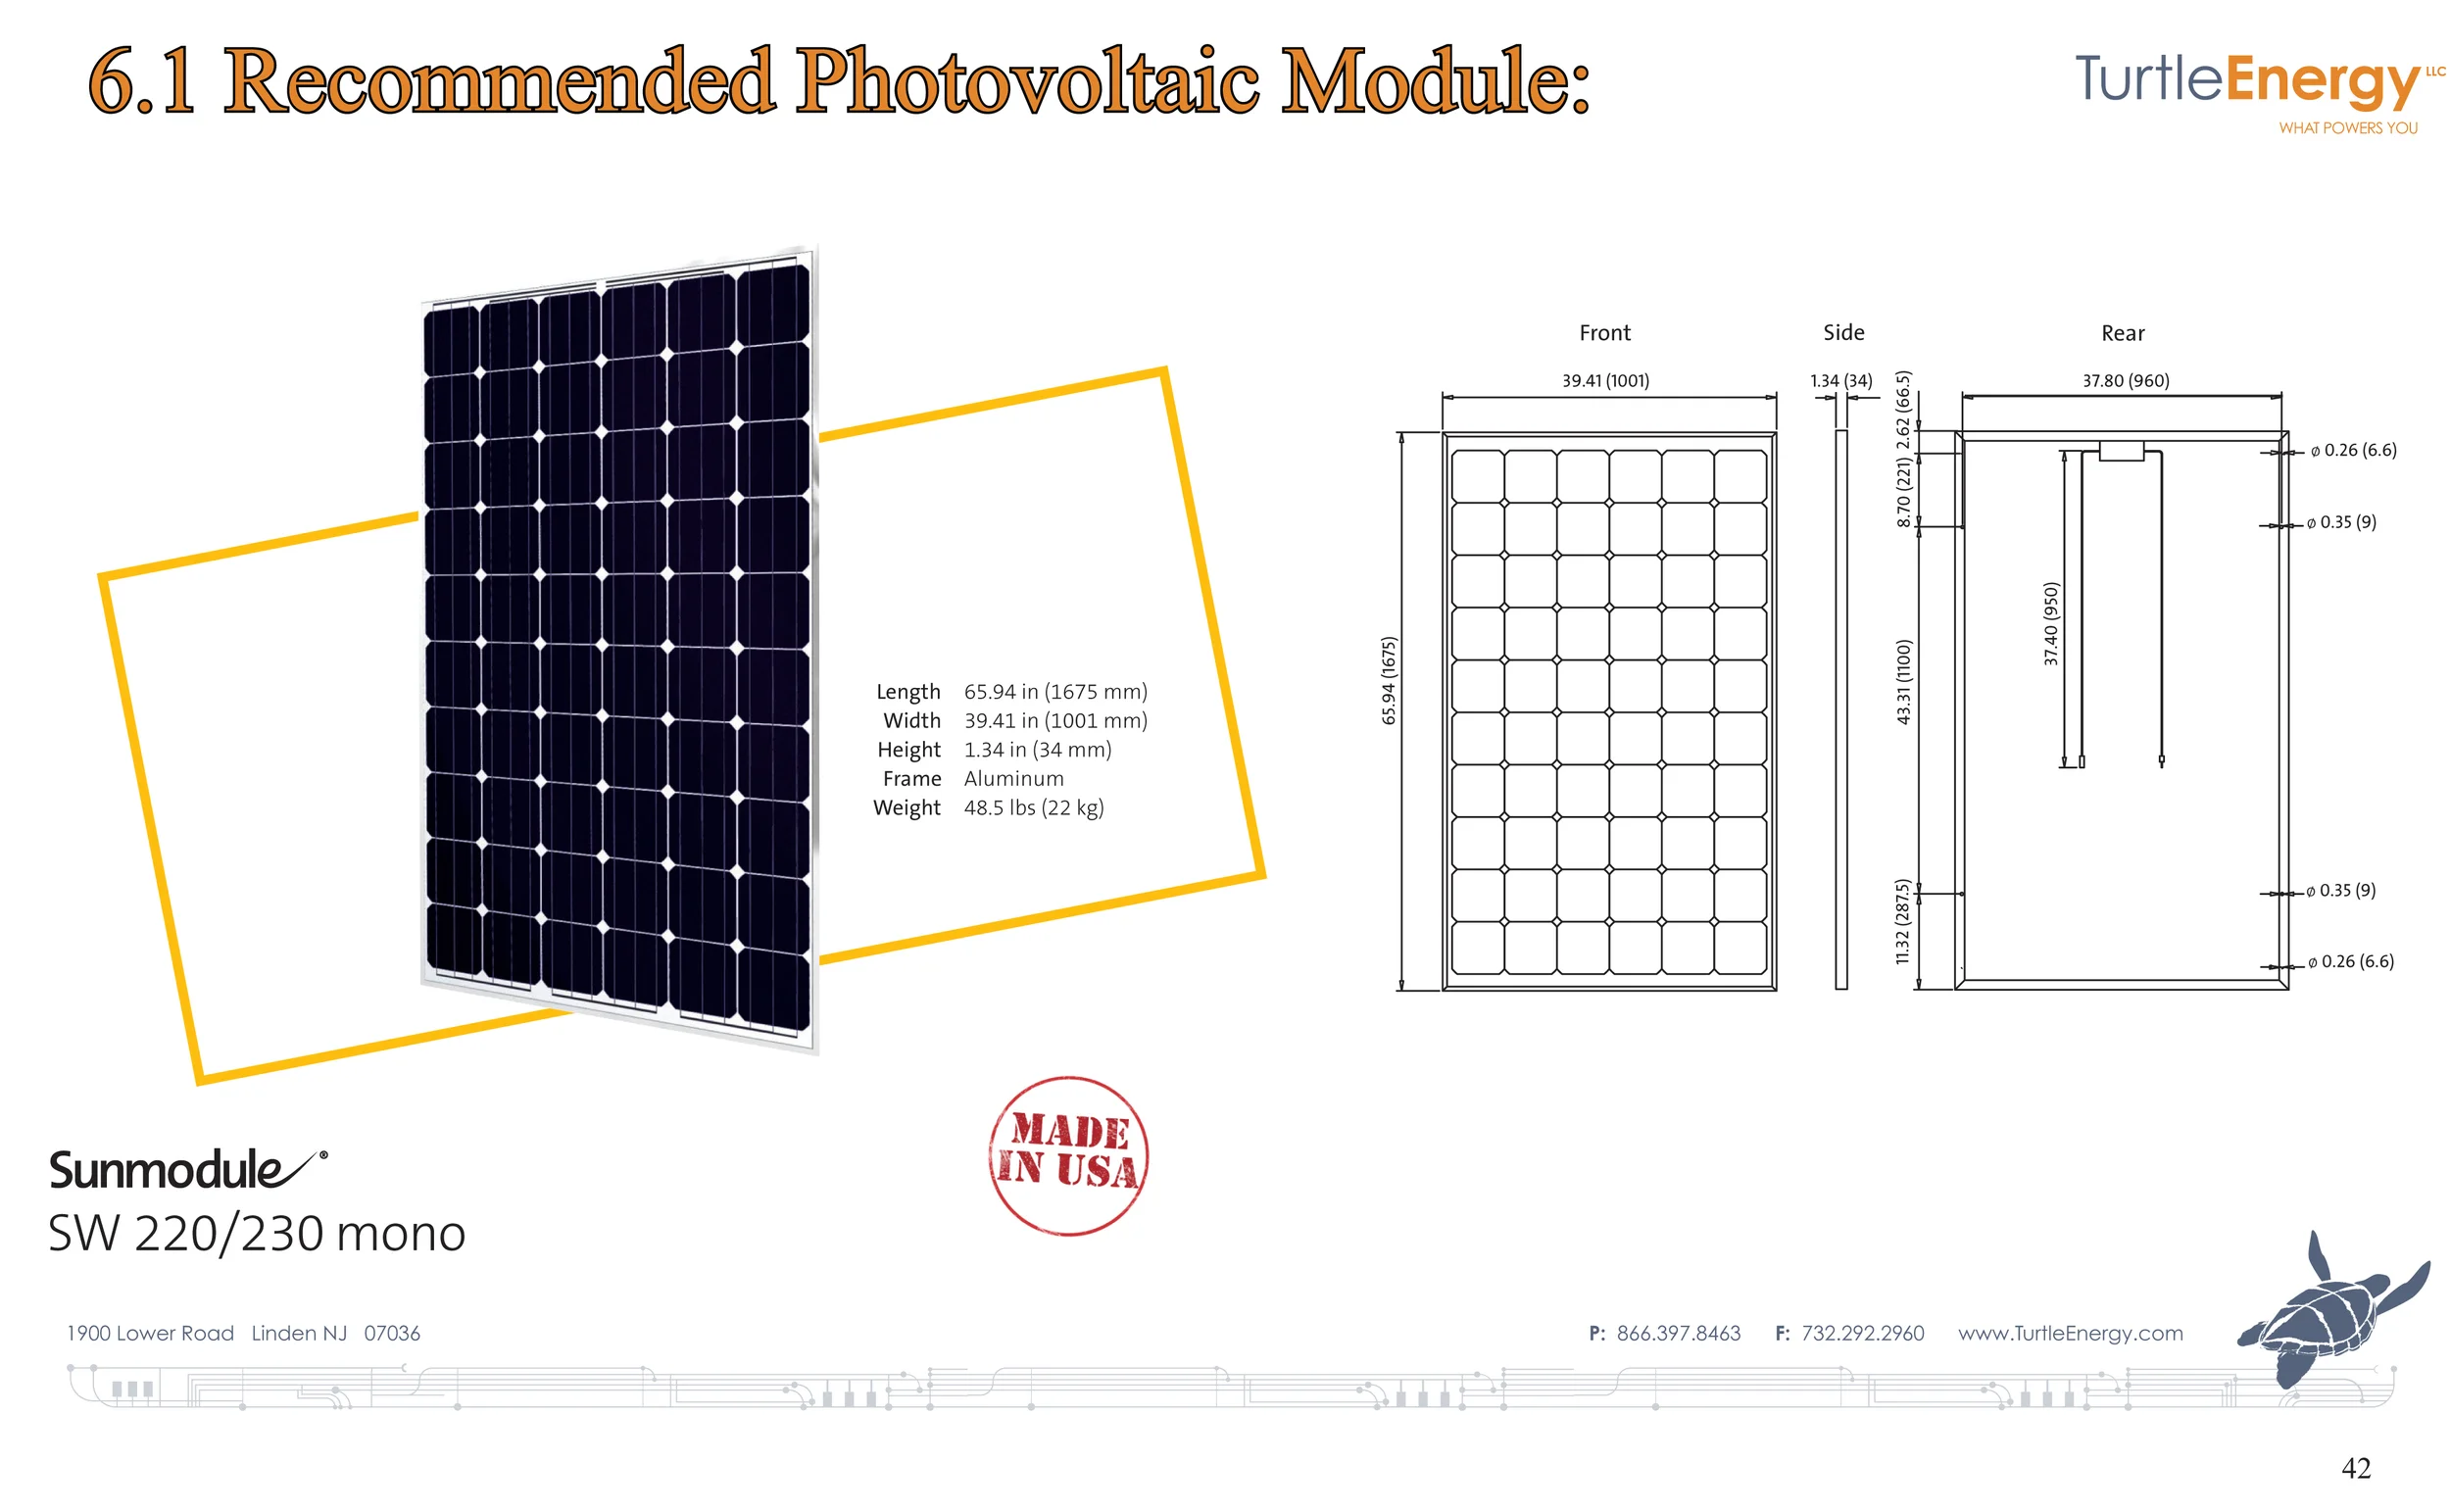
Figure 27: SolarWorld is a premium solar module manufacturer based in Camarillo California.
The effort to maintain an entirely "Made in the USA" project was achieved to the end of construction. All solar panels,
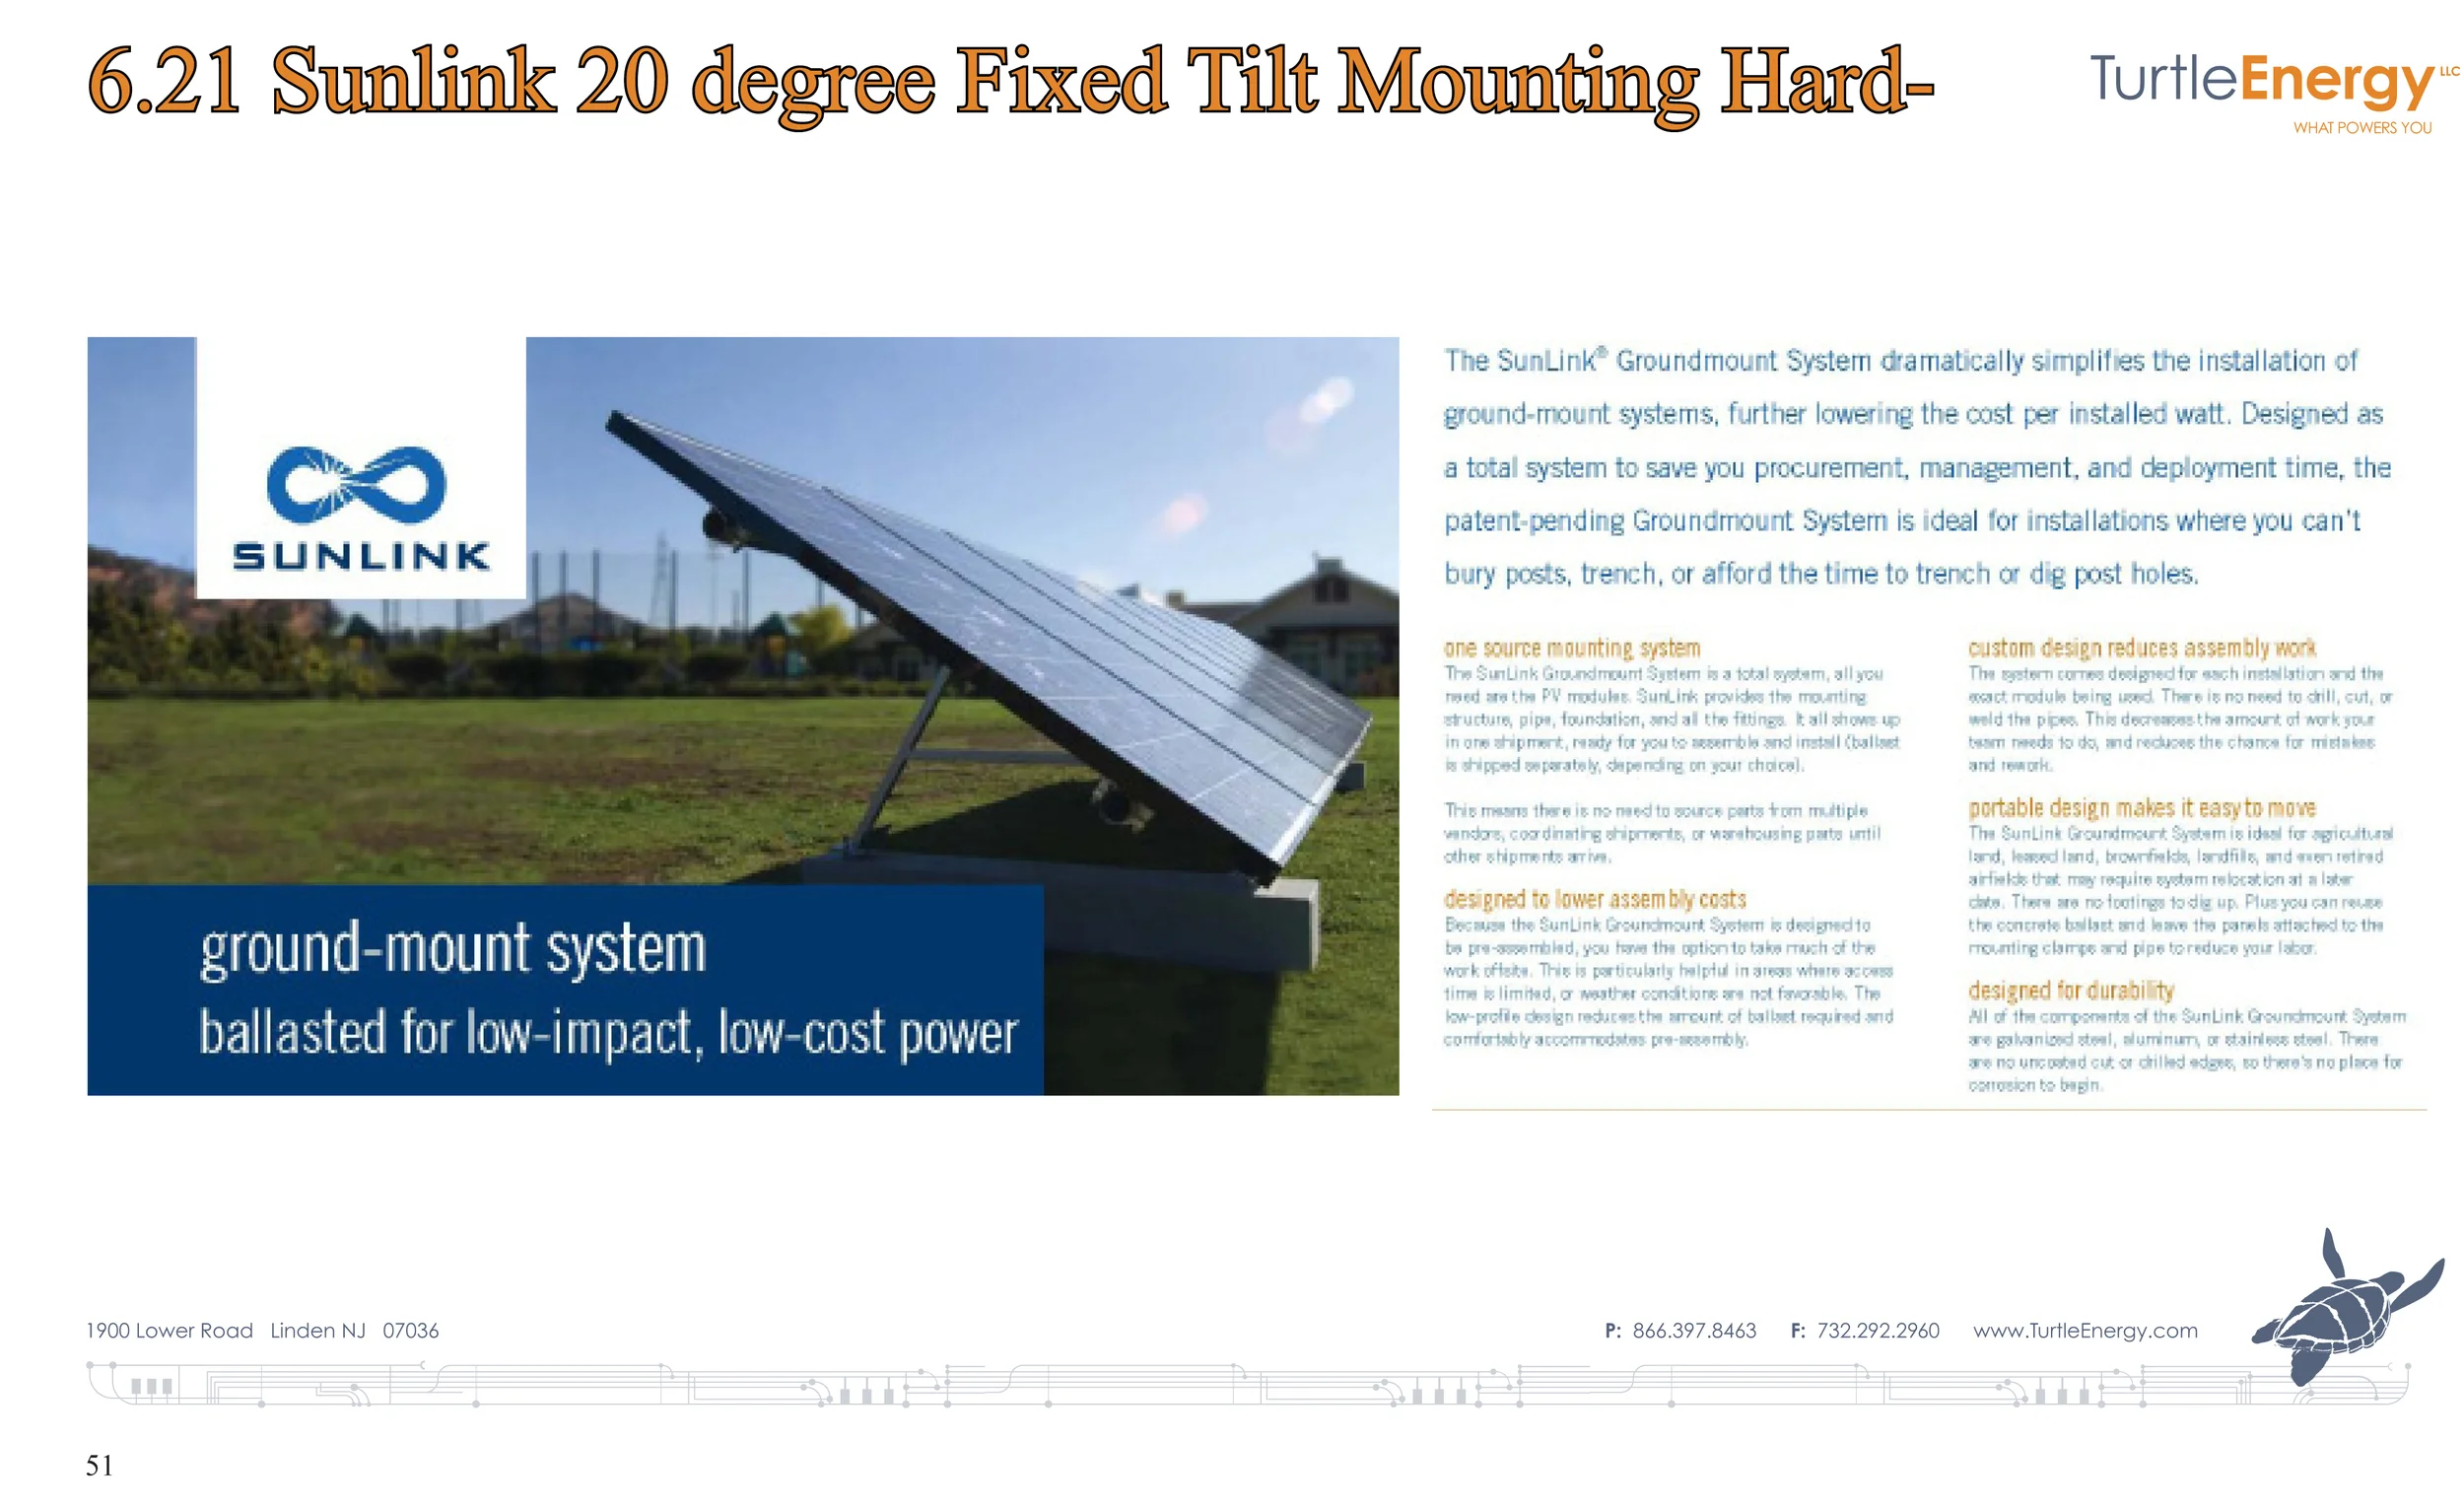
Figure 28: specification sheet for the SunLink self ballasted system
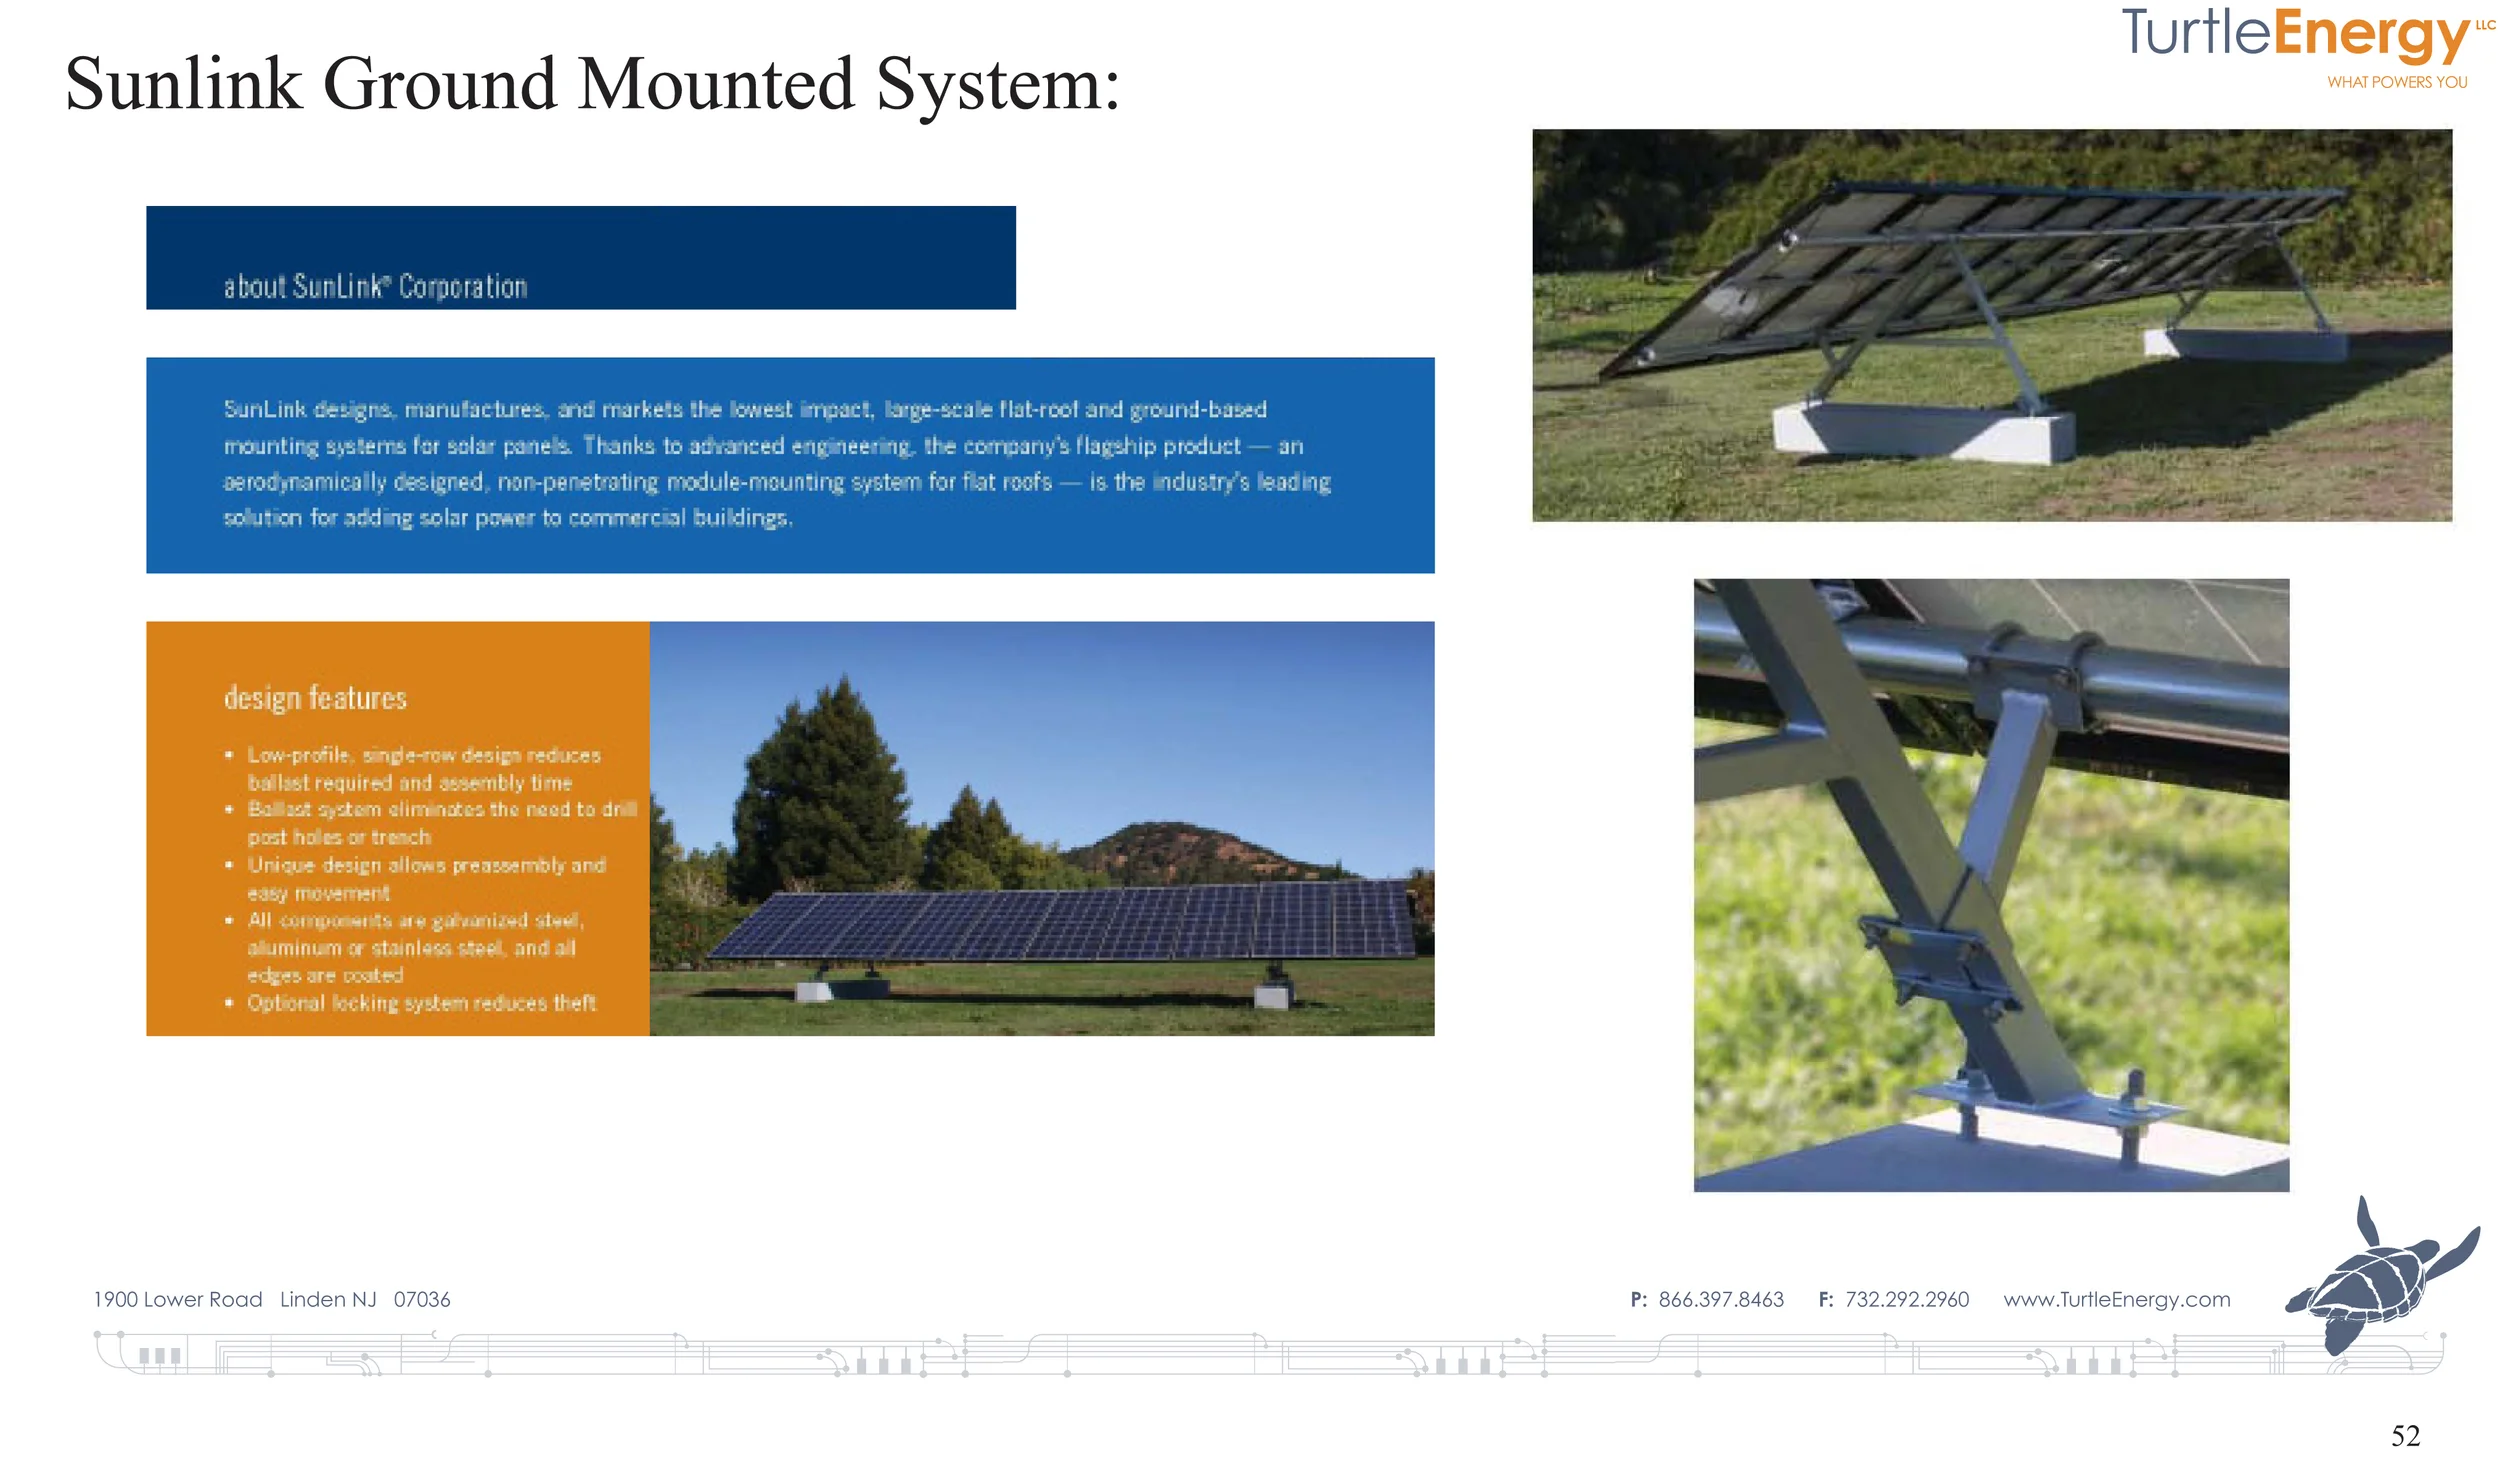
Figure 29: The Sunlink Bracketry is constructed entirely of nonferrous metal and is very strong.
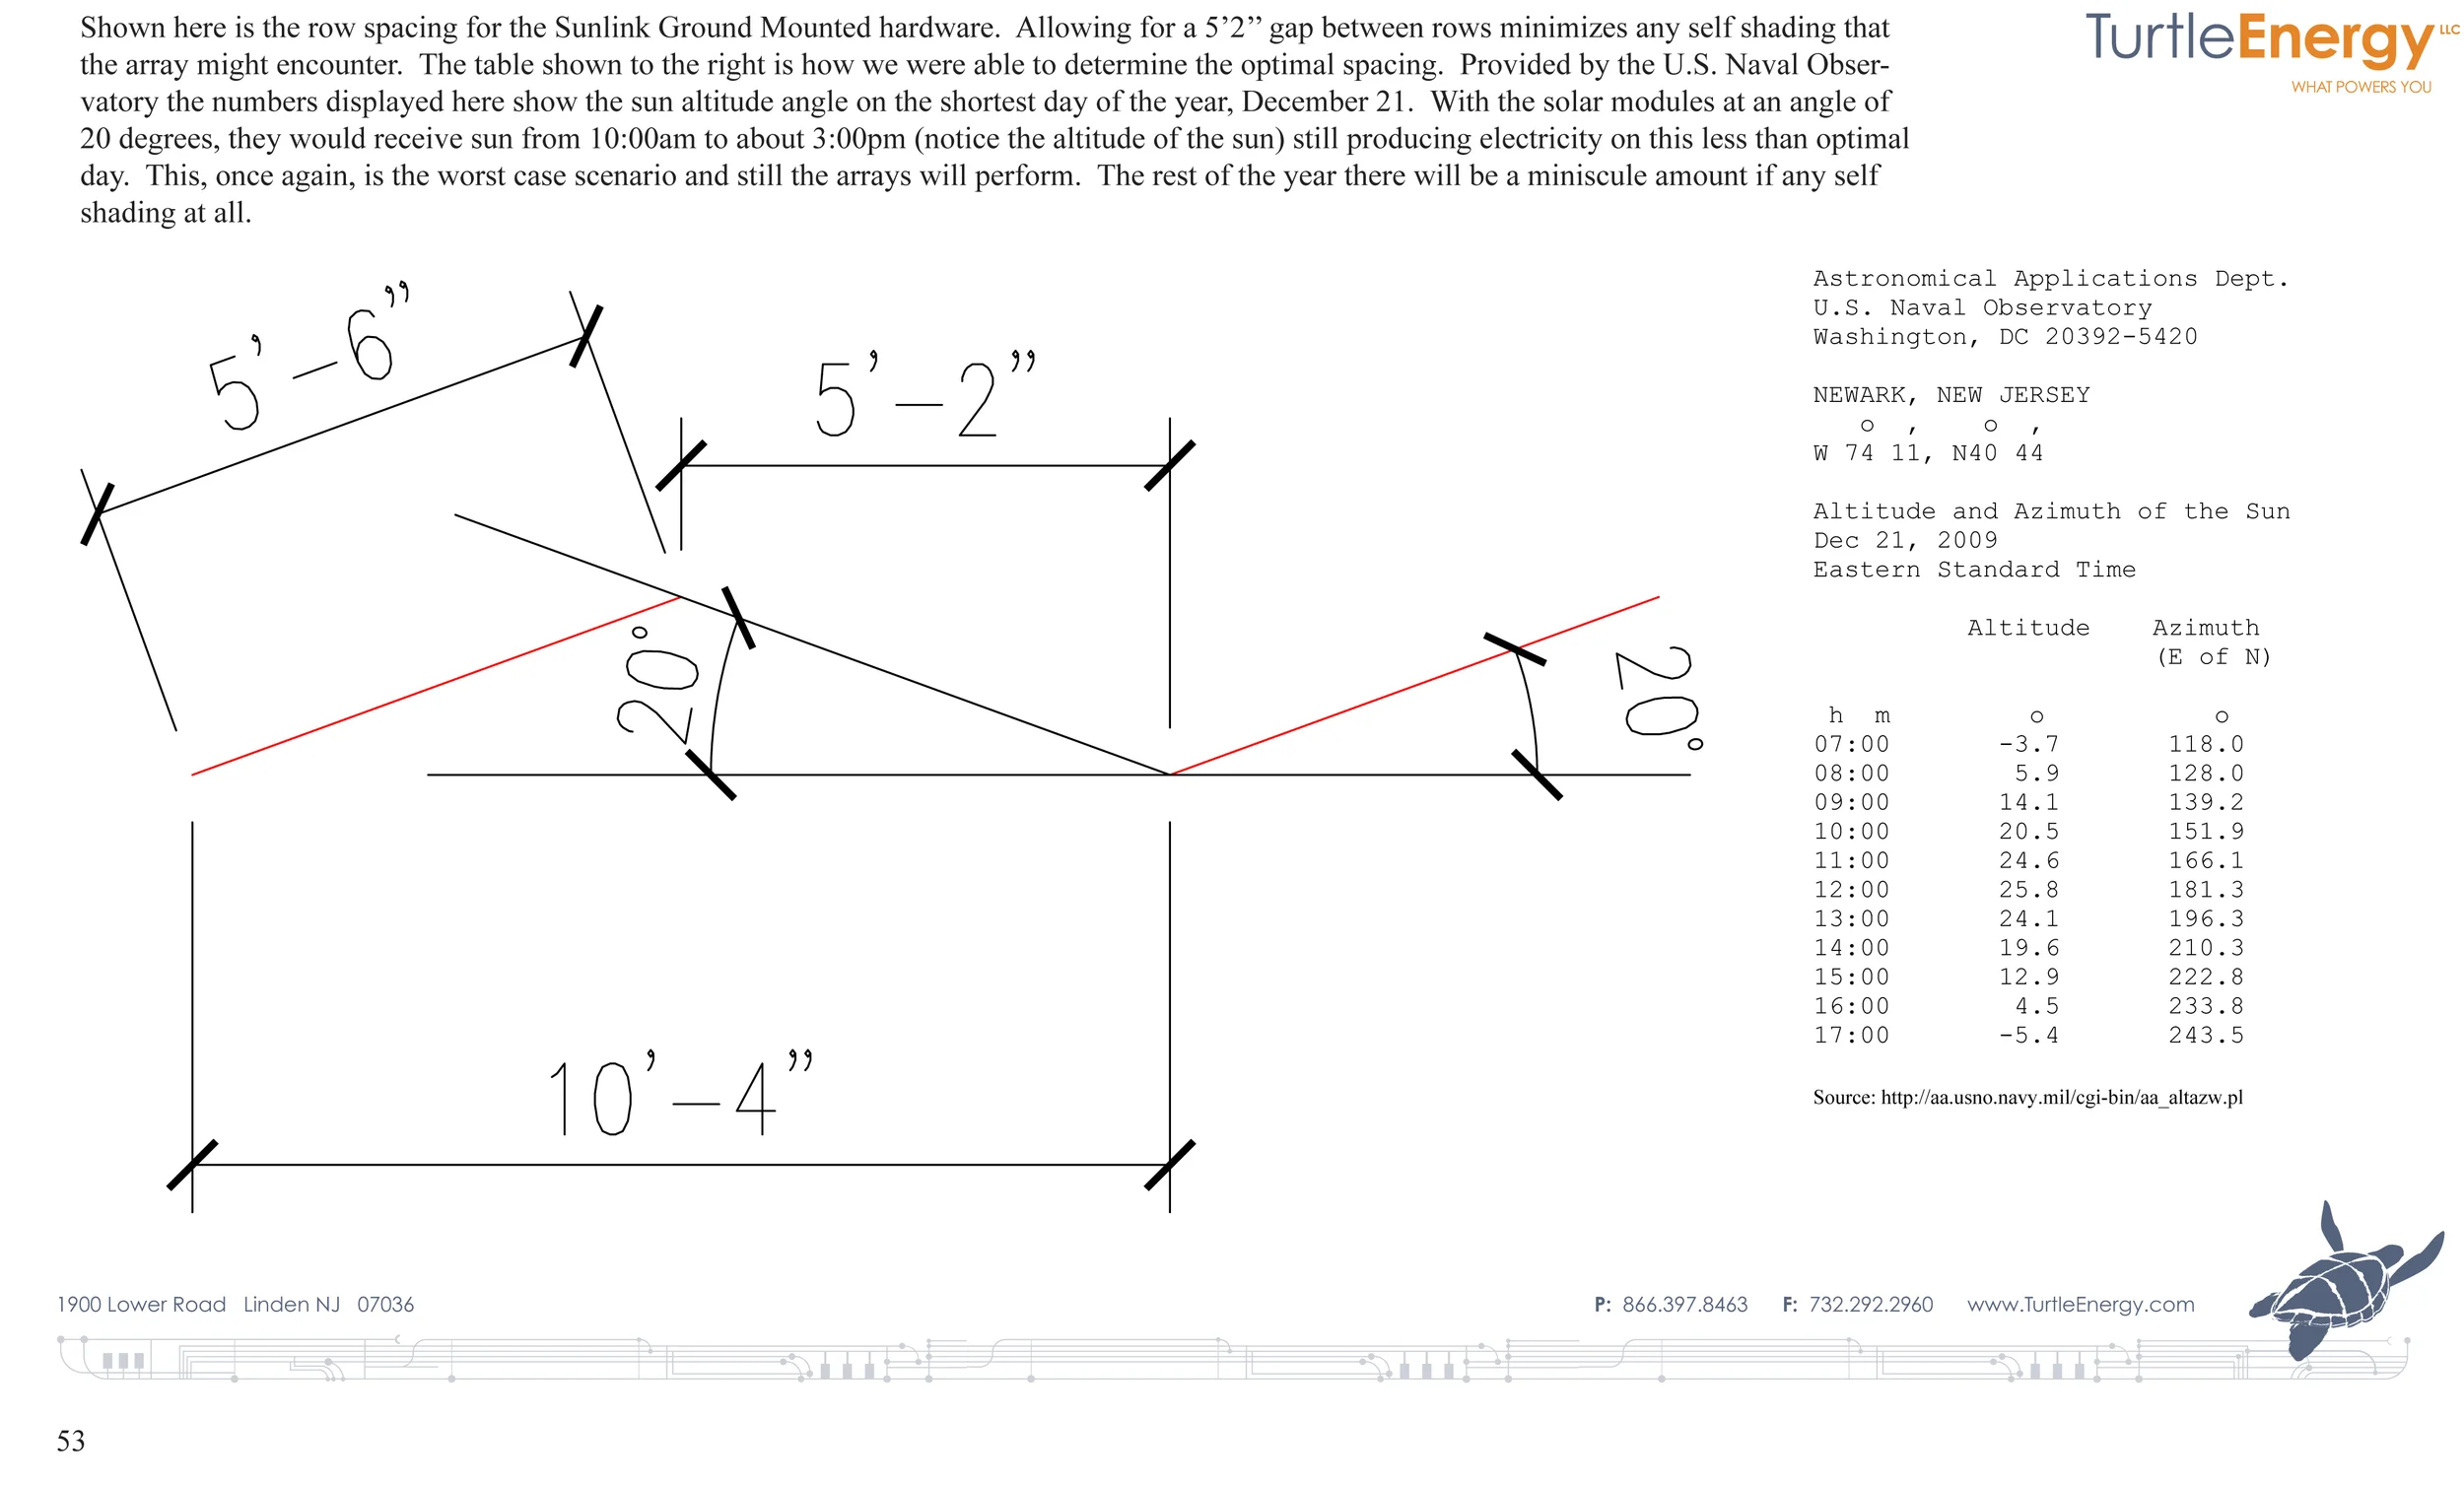
Figure 30: ...determining the optimal angle for increased summertime performance when the sun altitude is higher
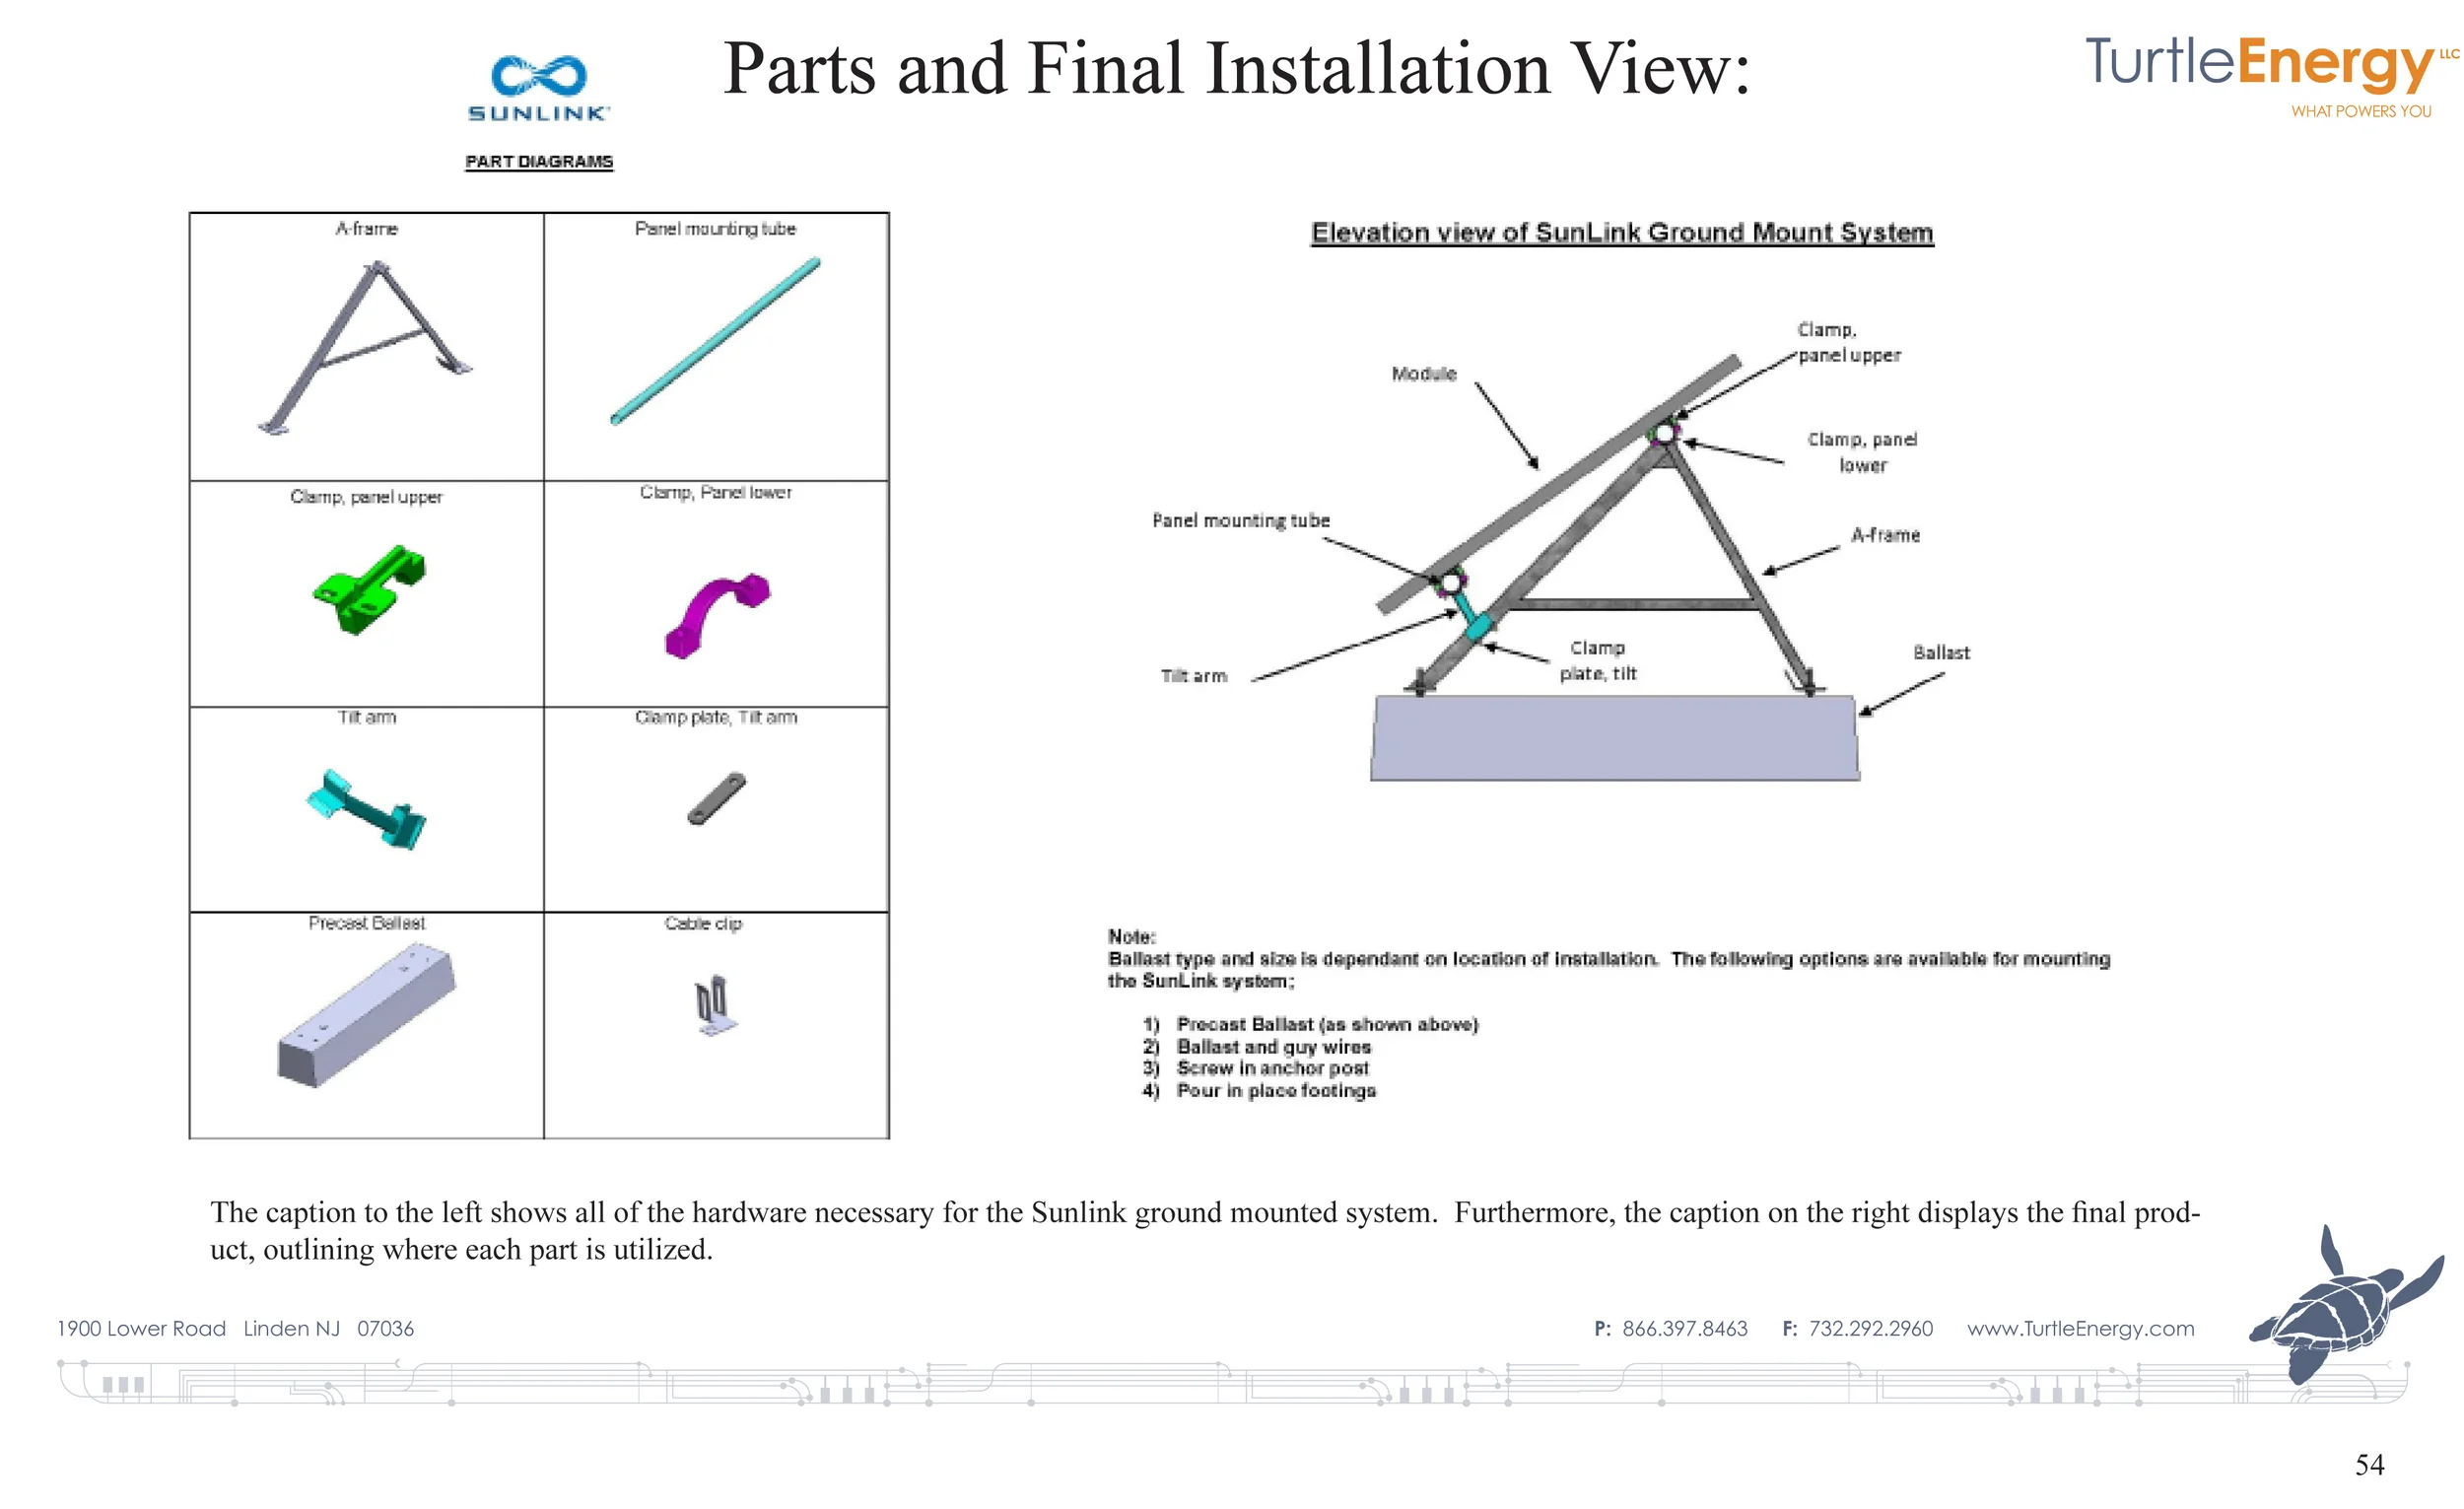
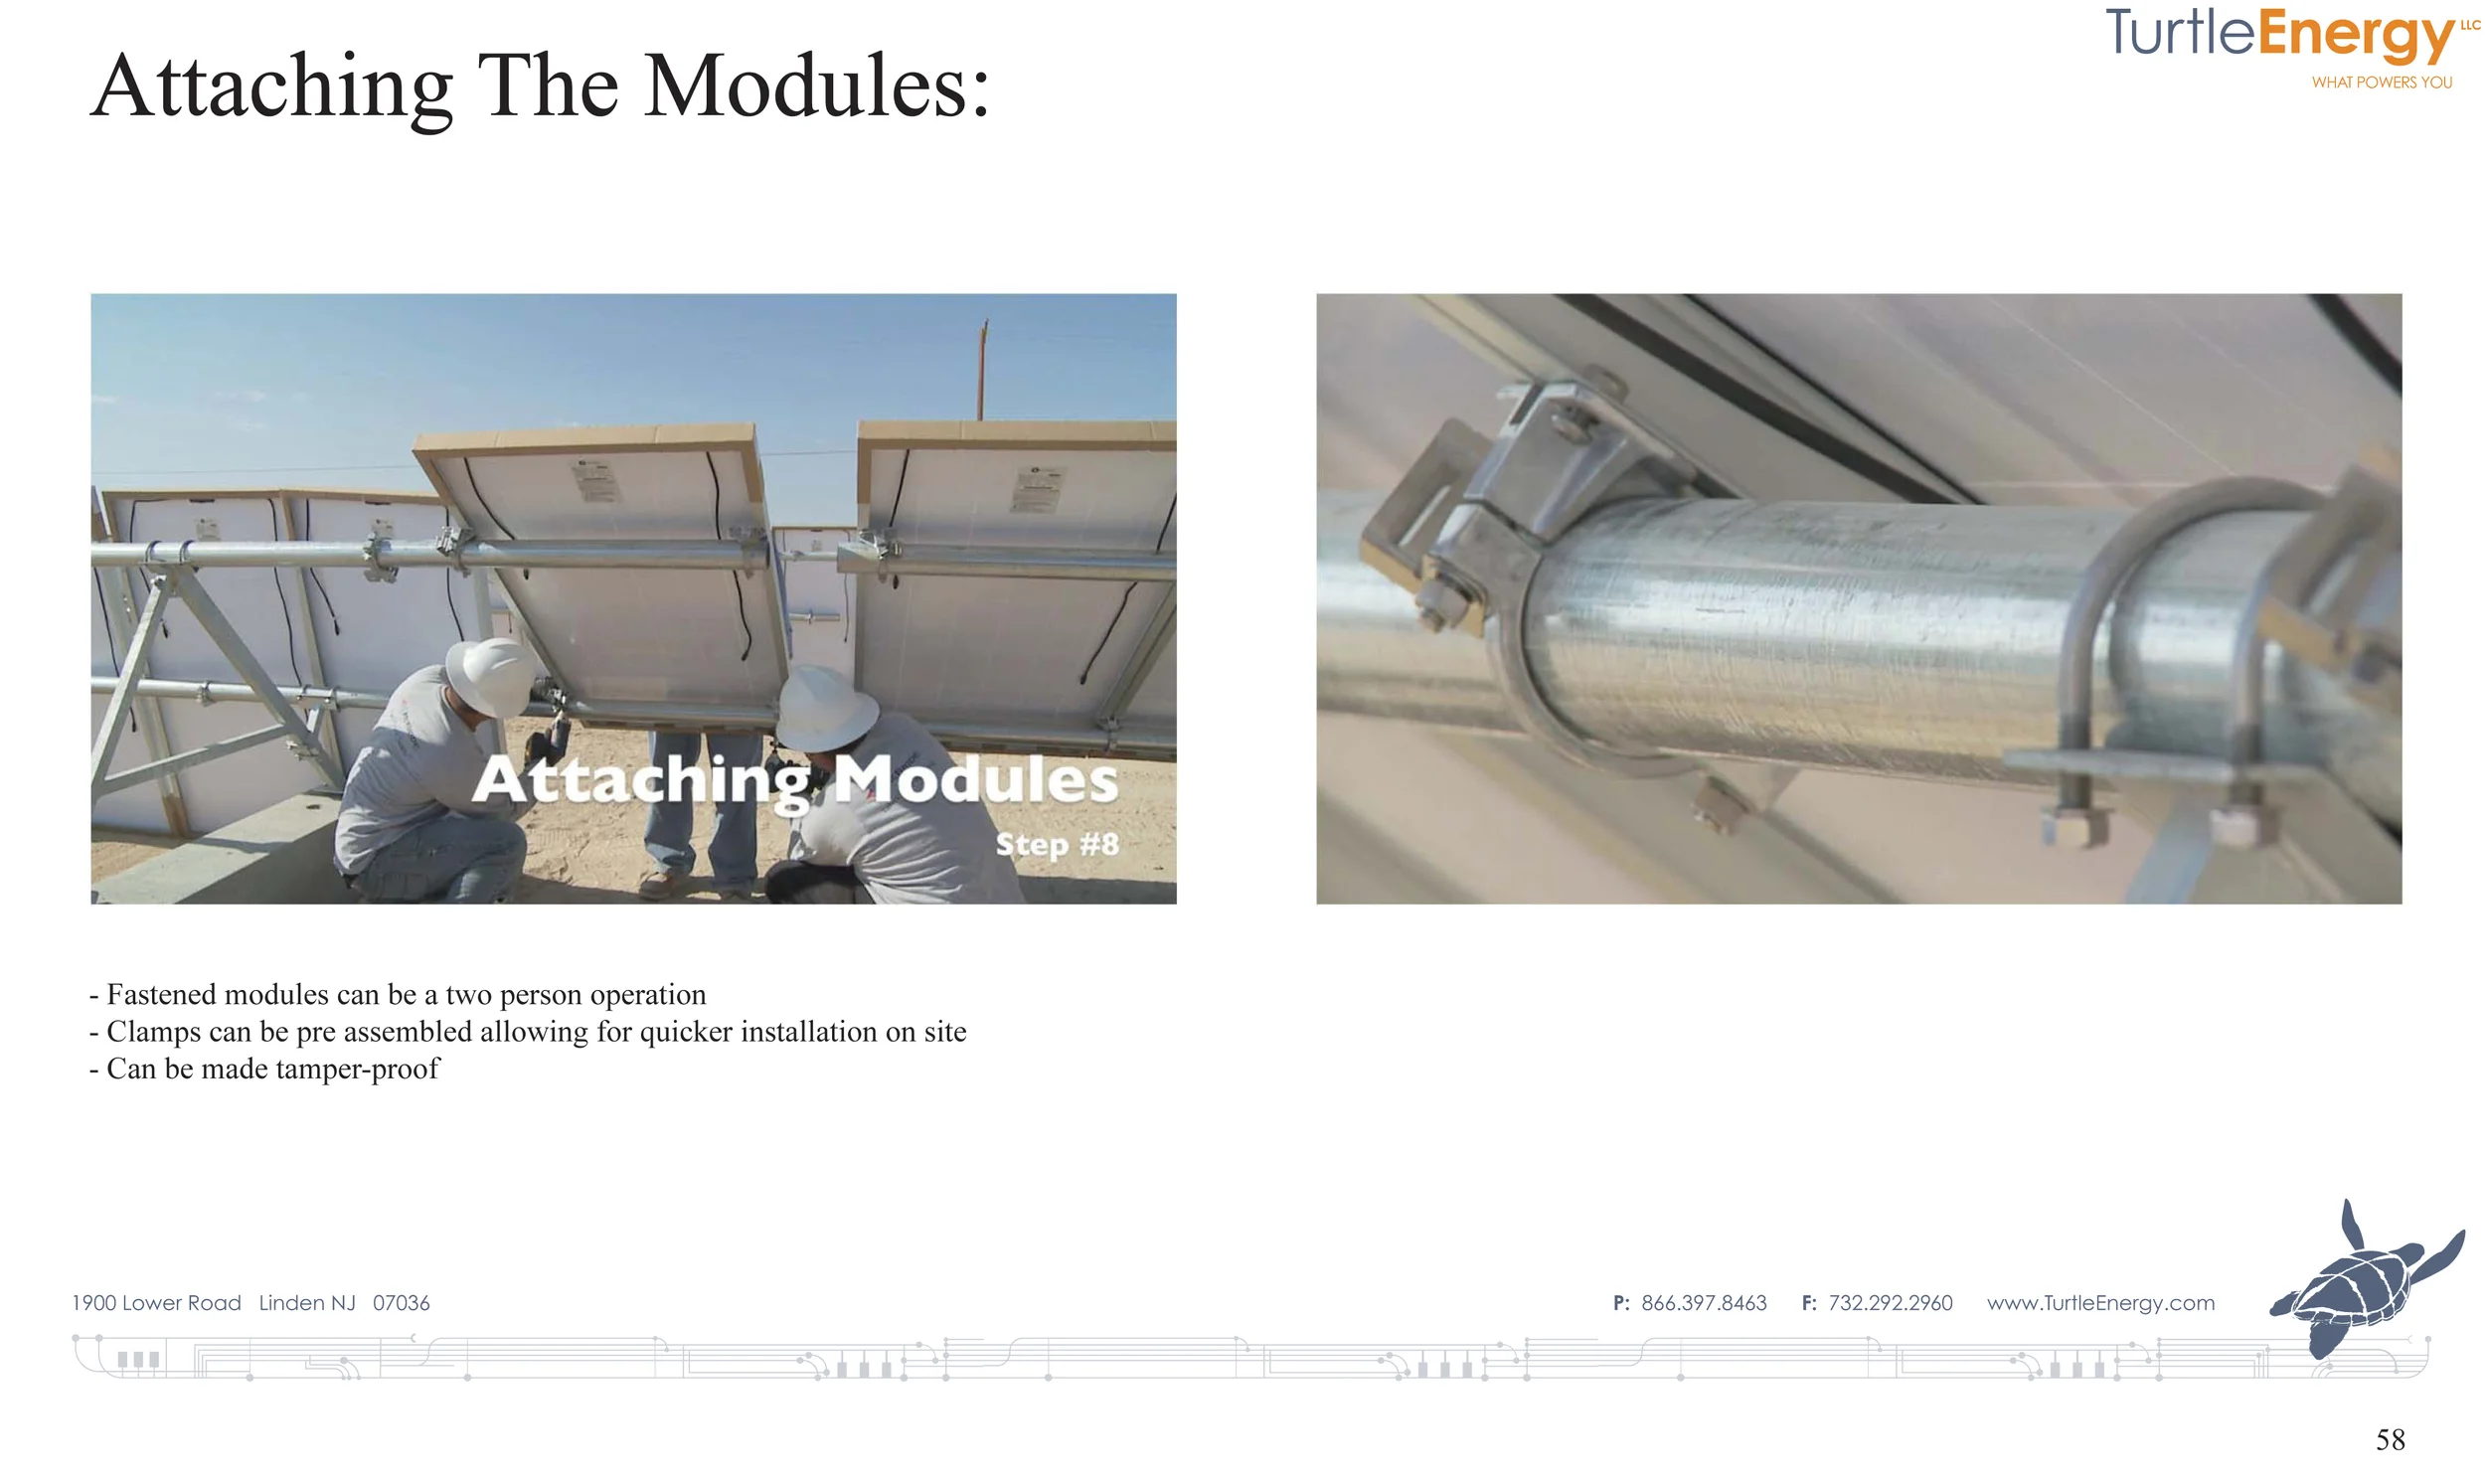
Figure 31: the components that go into this SunLink self ballasted fixed tilt system are easily obtained, replaced and are very durable.
When choosing a mounting system it is important to be able to replace parts.

Figure 32: Deploying the precast concrete ballast blocks is faster than placing concrete in situ.
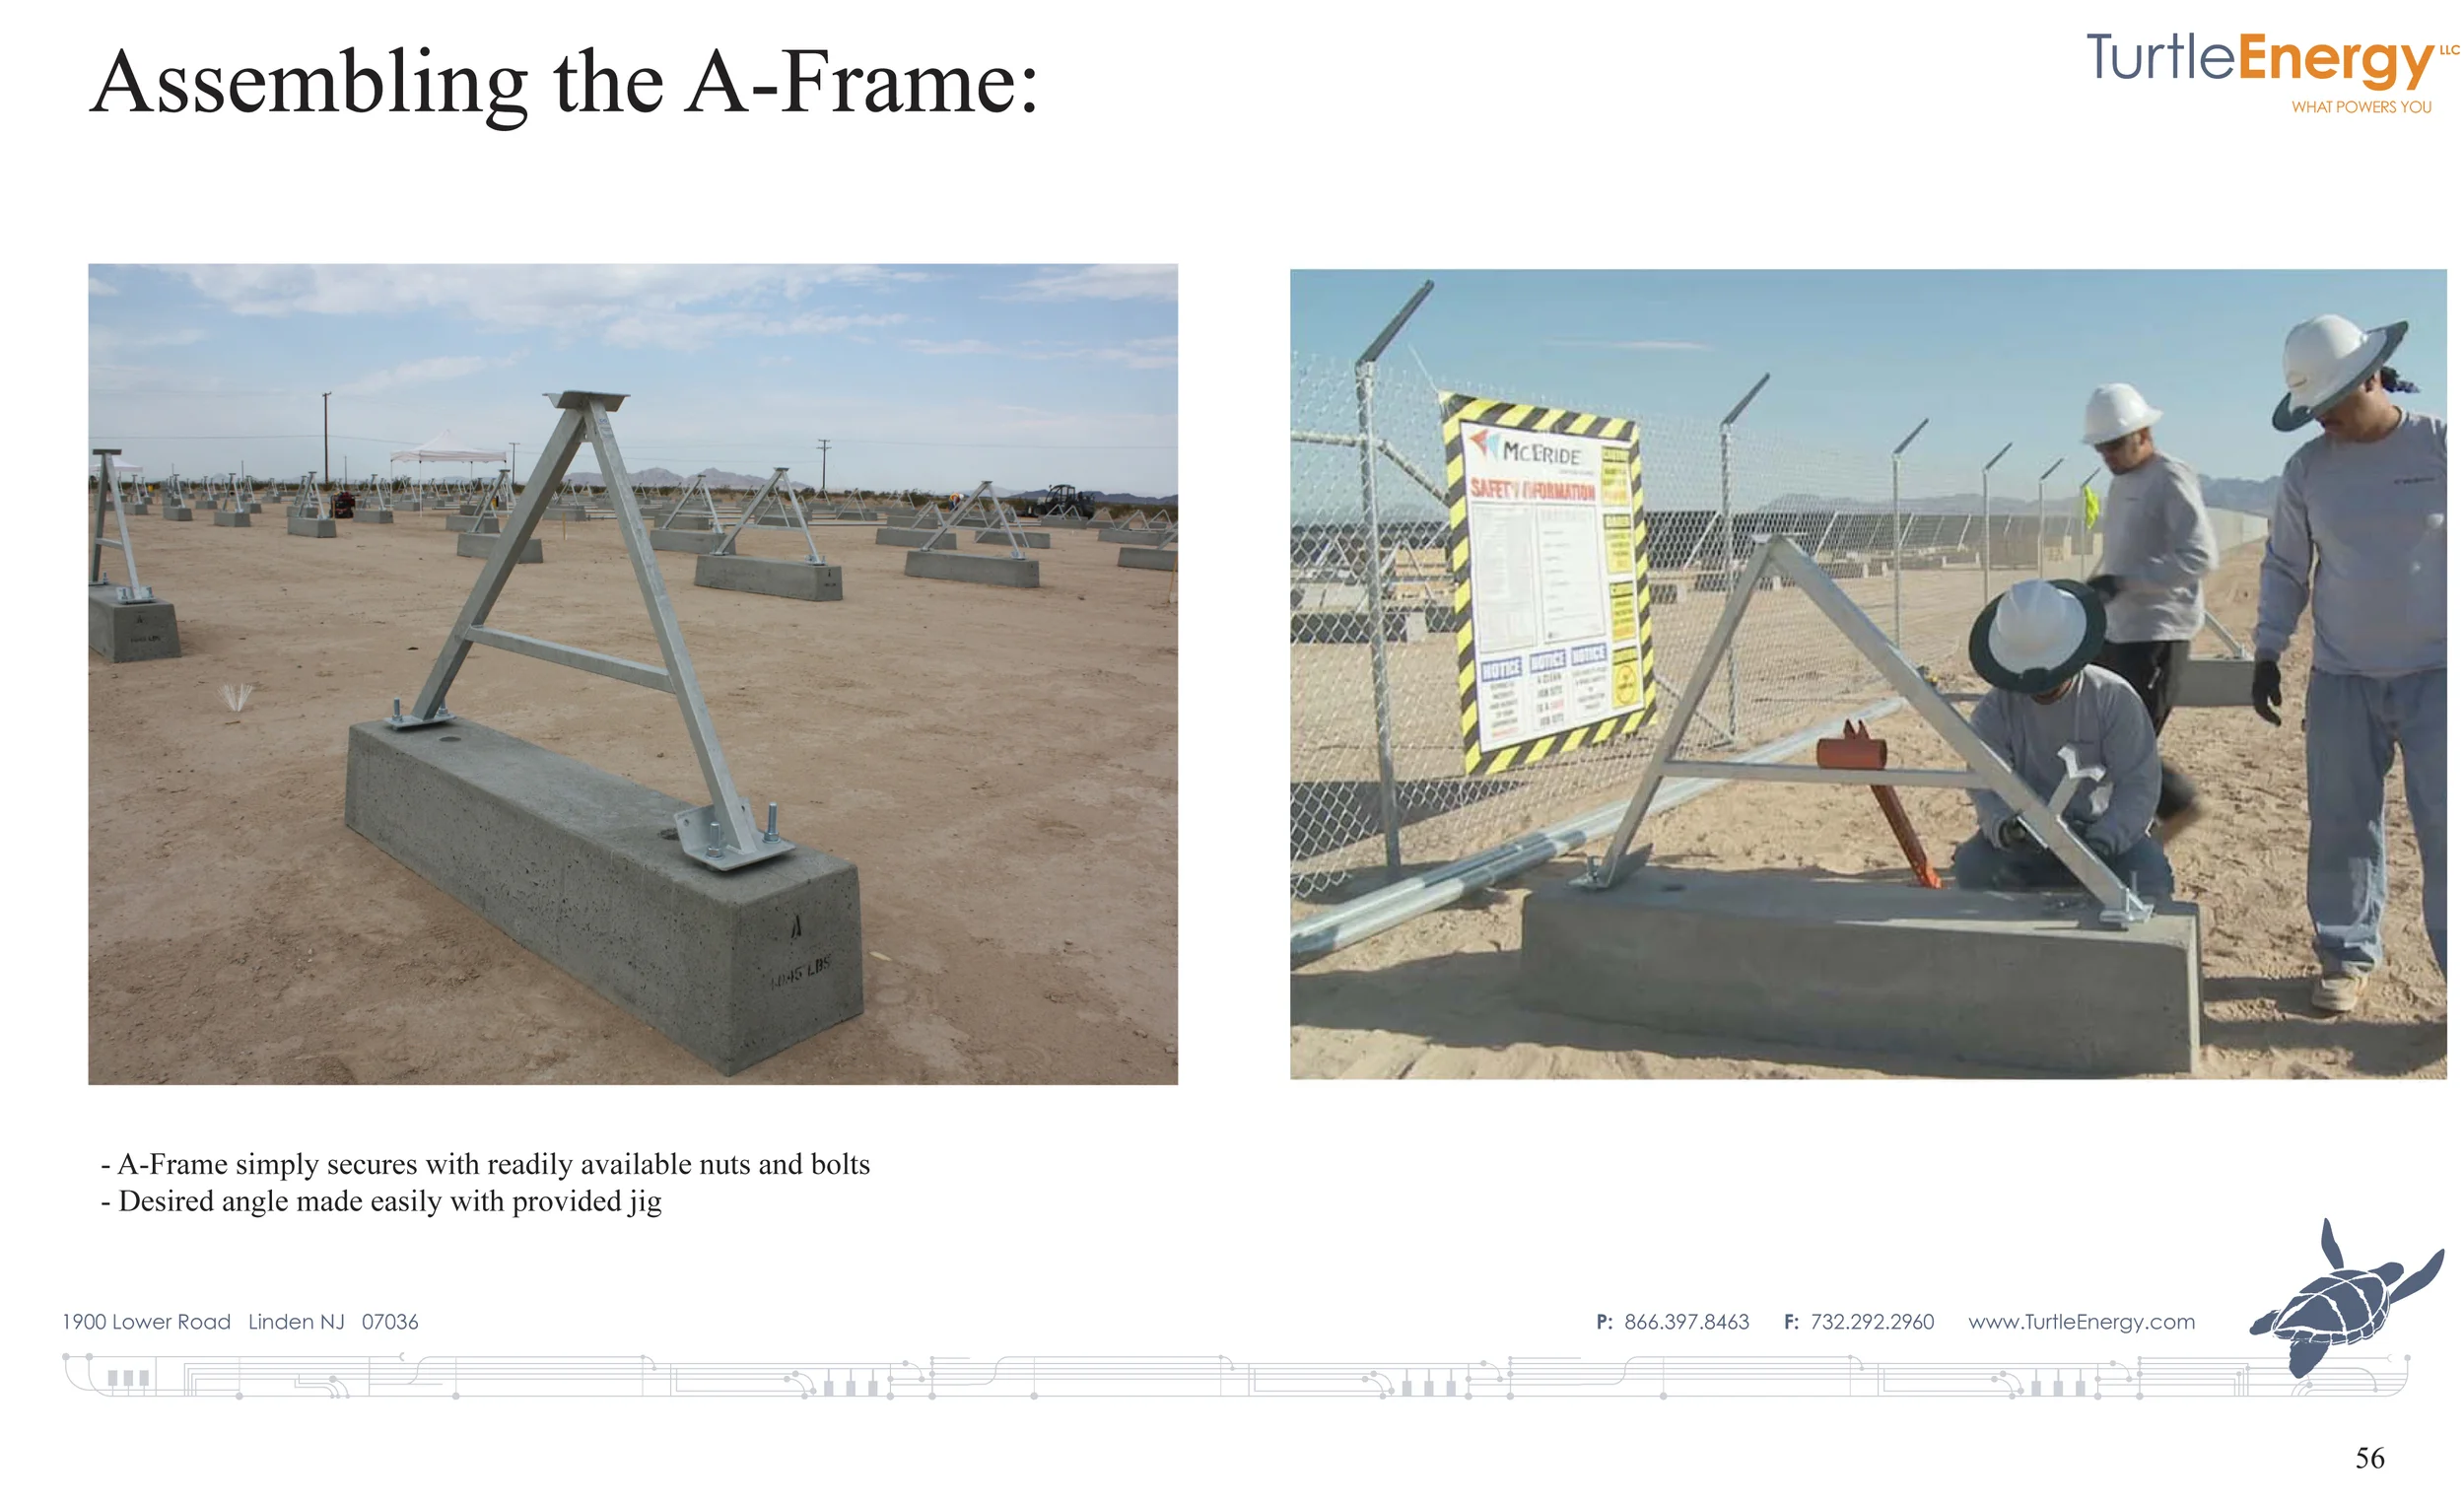
Figure 33: Bolting the bracket to the ballast block is a quick operation.
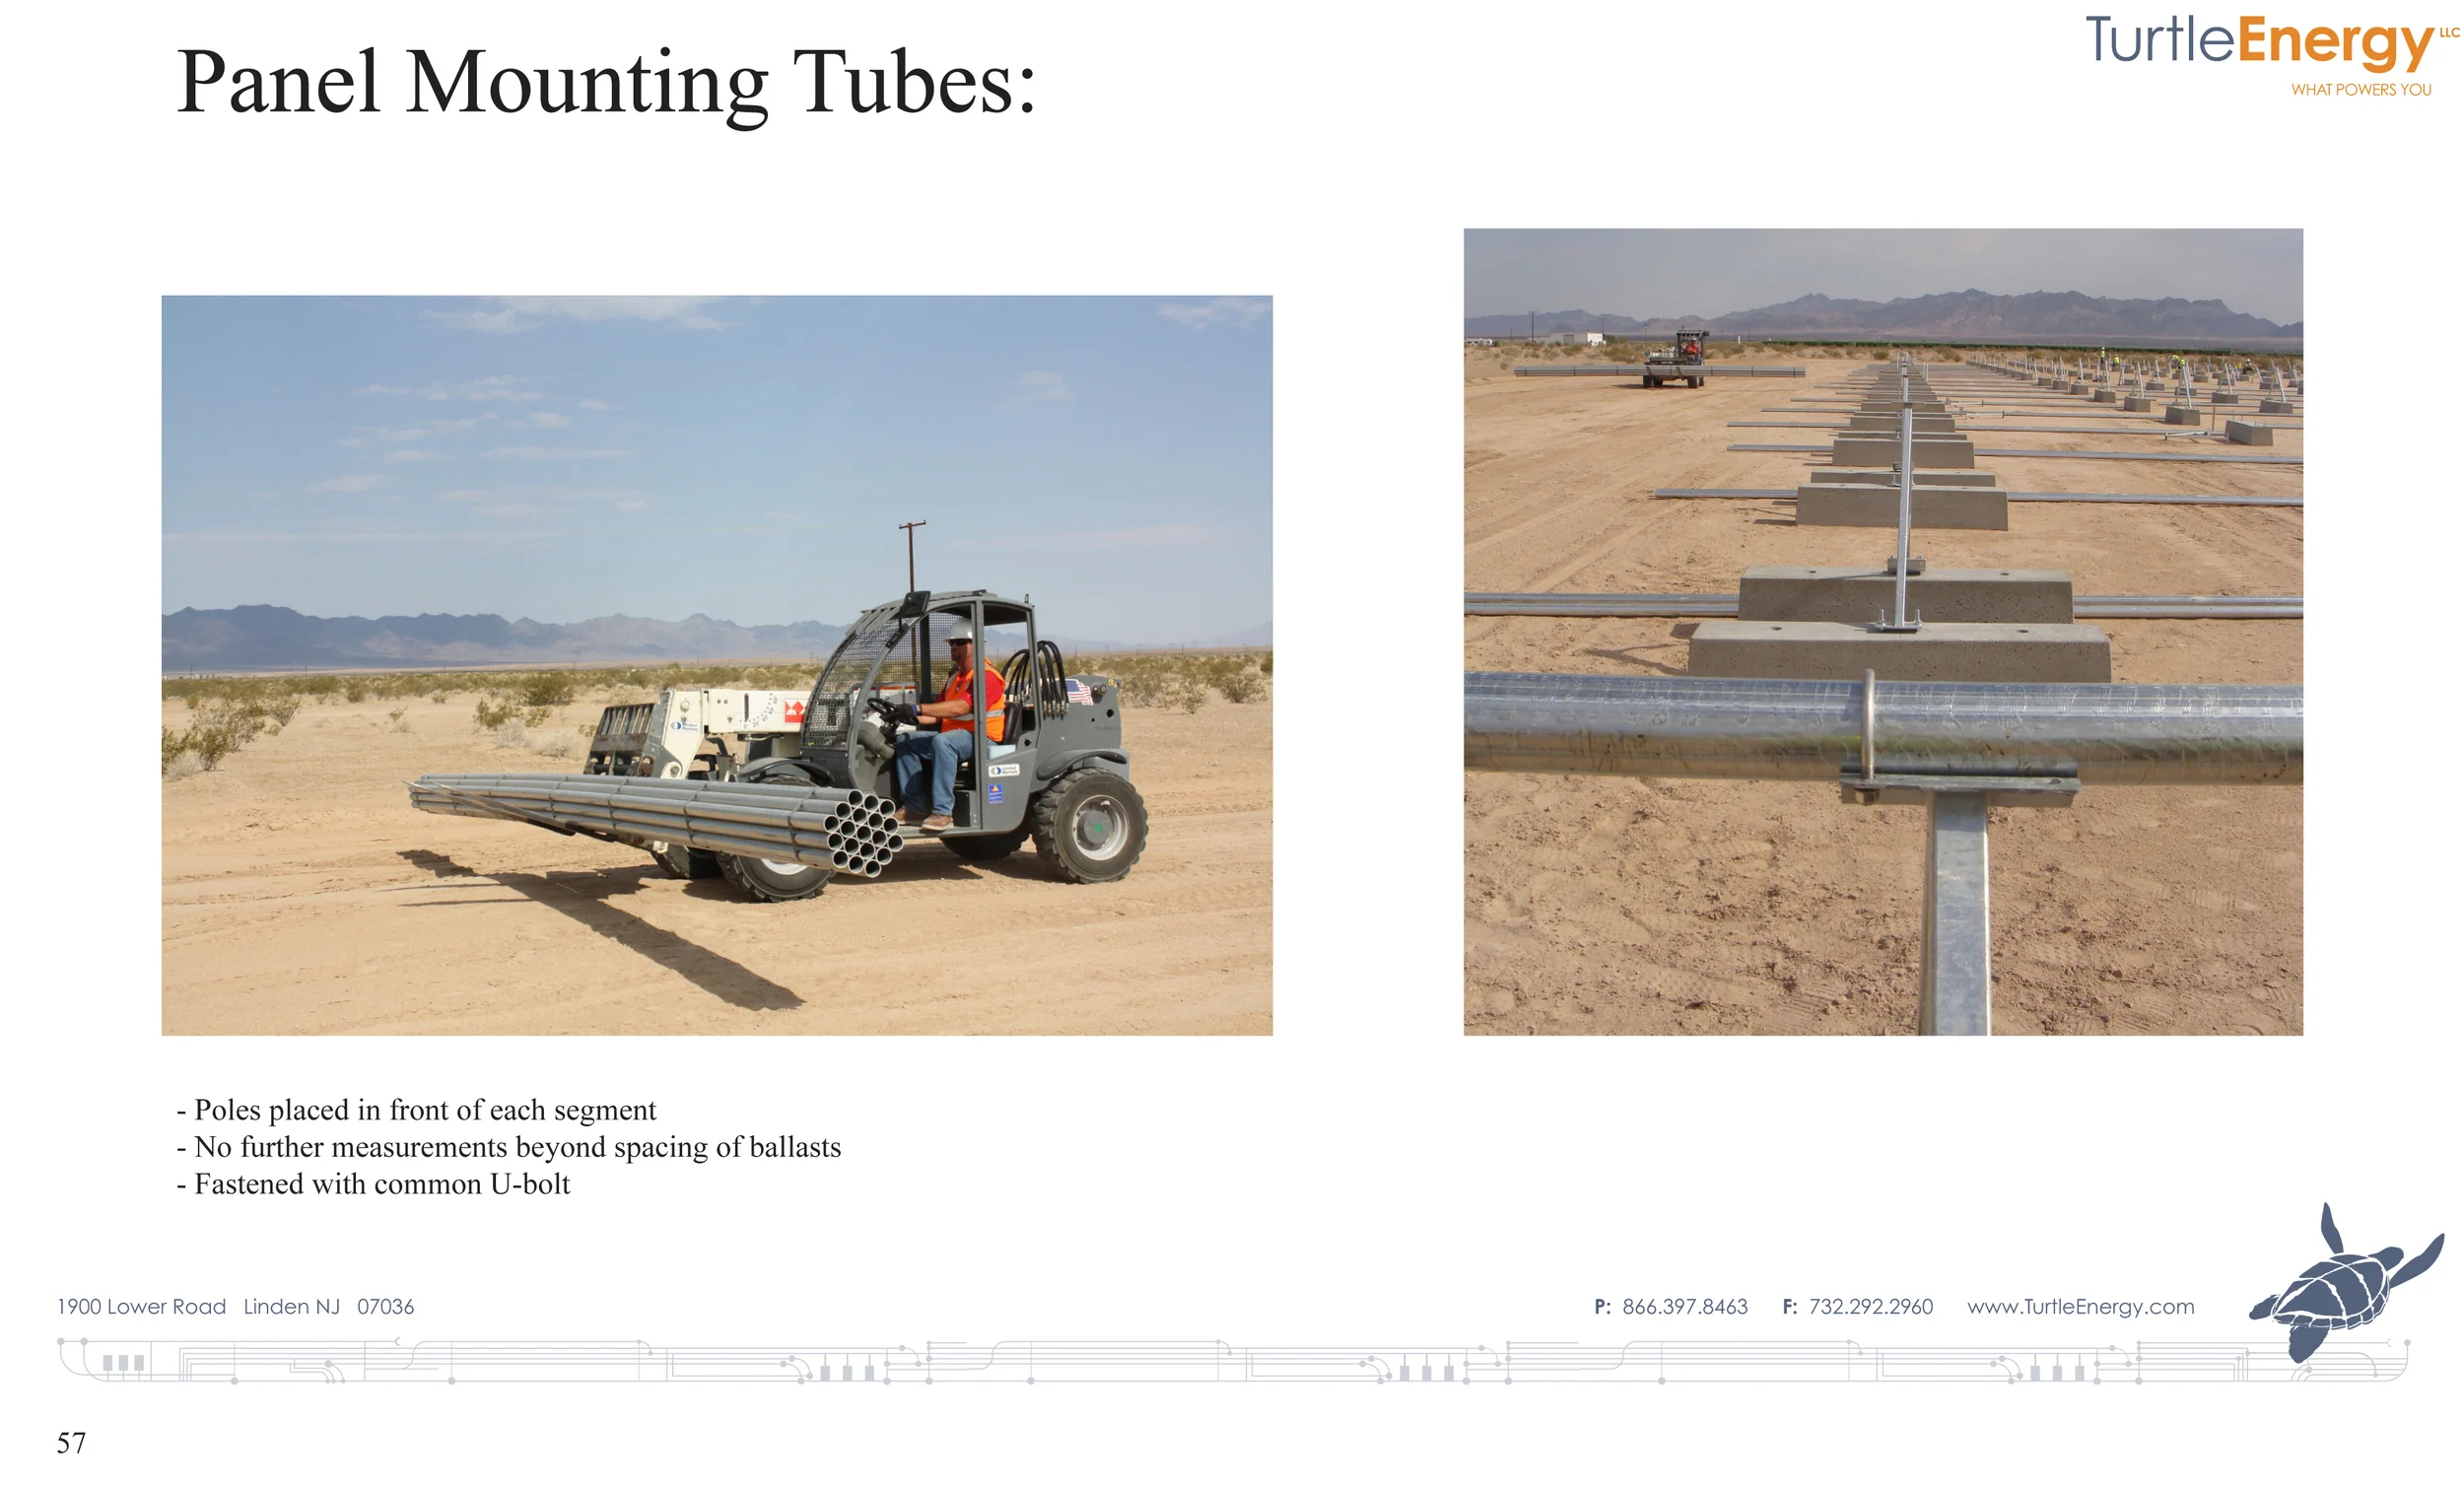
Figure 34: Accurate alignment of the mounting system and accurate spacing is of critical importance to energy production.
