6000kW Solar Project for Lawrenceville School- Design Development Phase
Project Data
End-User: Lawrenceville School
Installer: Lighton Industries
Location: Lawrenceville, New Jersey
Date of install: May 2012
Size of system in kW: 6000kW
Energy produced since installation: ~27GWh
Special Challenges Met: Environmentally Protected Farming Land
Project Brief
THE LAWRENCEVILLE SCHOOL SOLAR PROJECT
Project Developer: TurtleEnergy LLC, Date Built: 2012
Client: Sold to KDC Solar
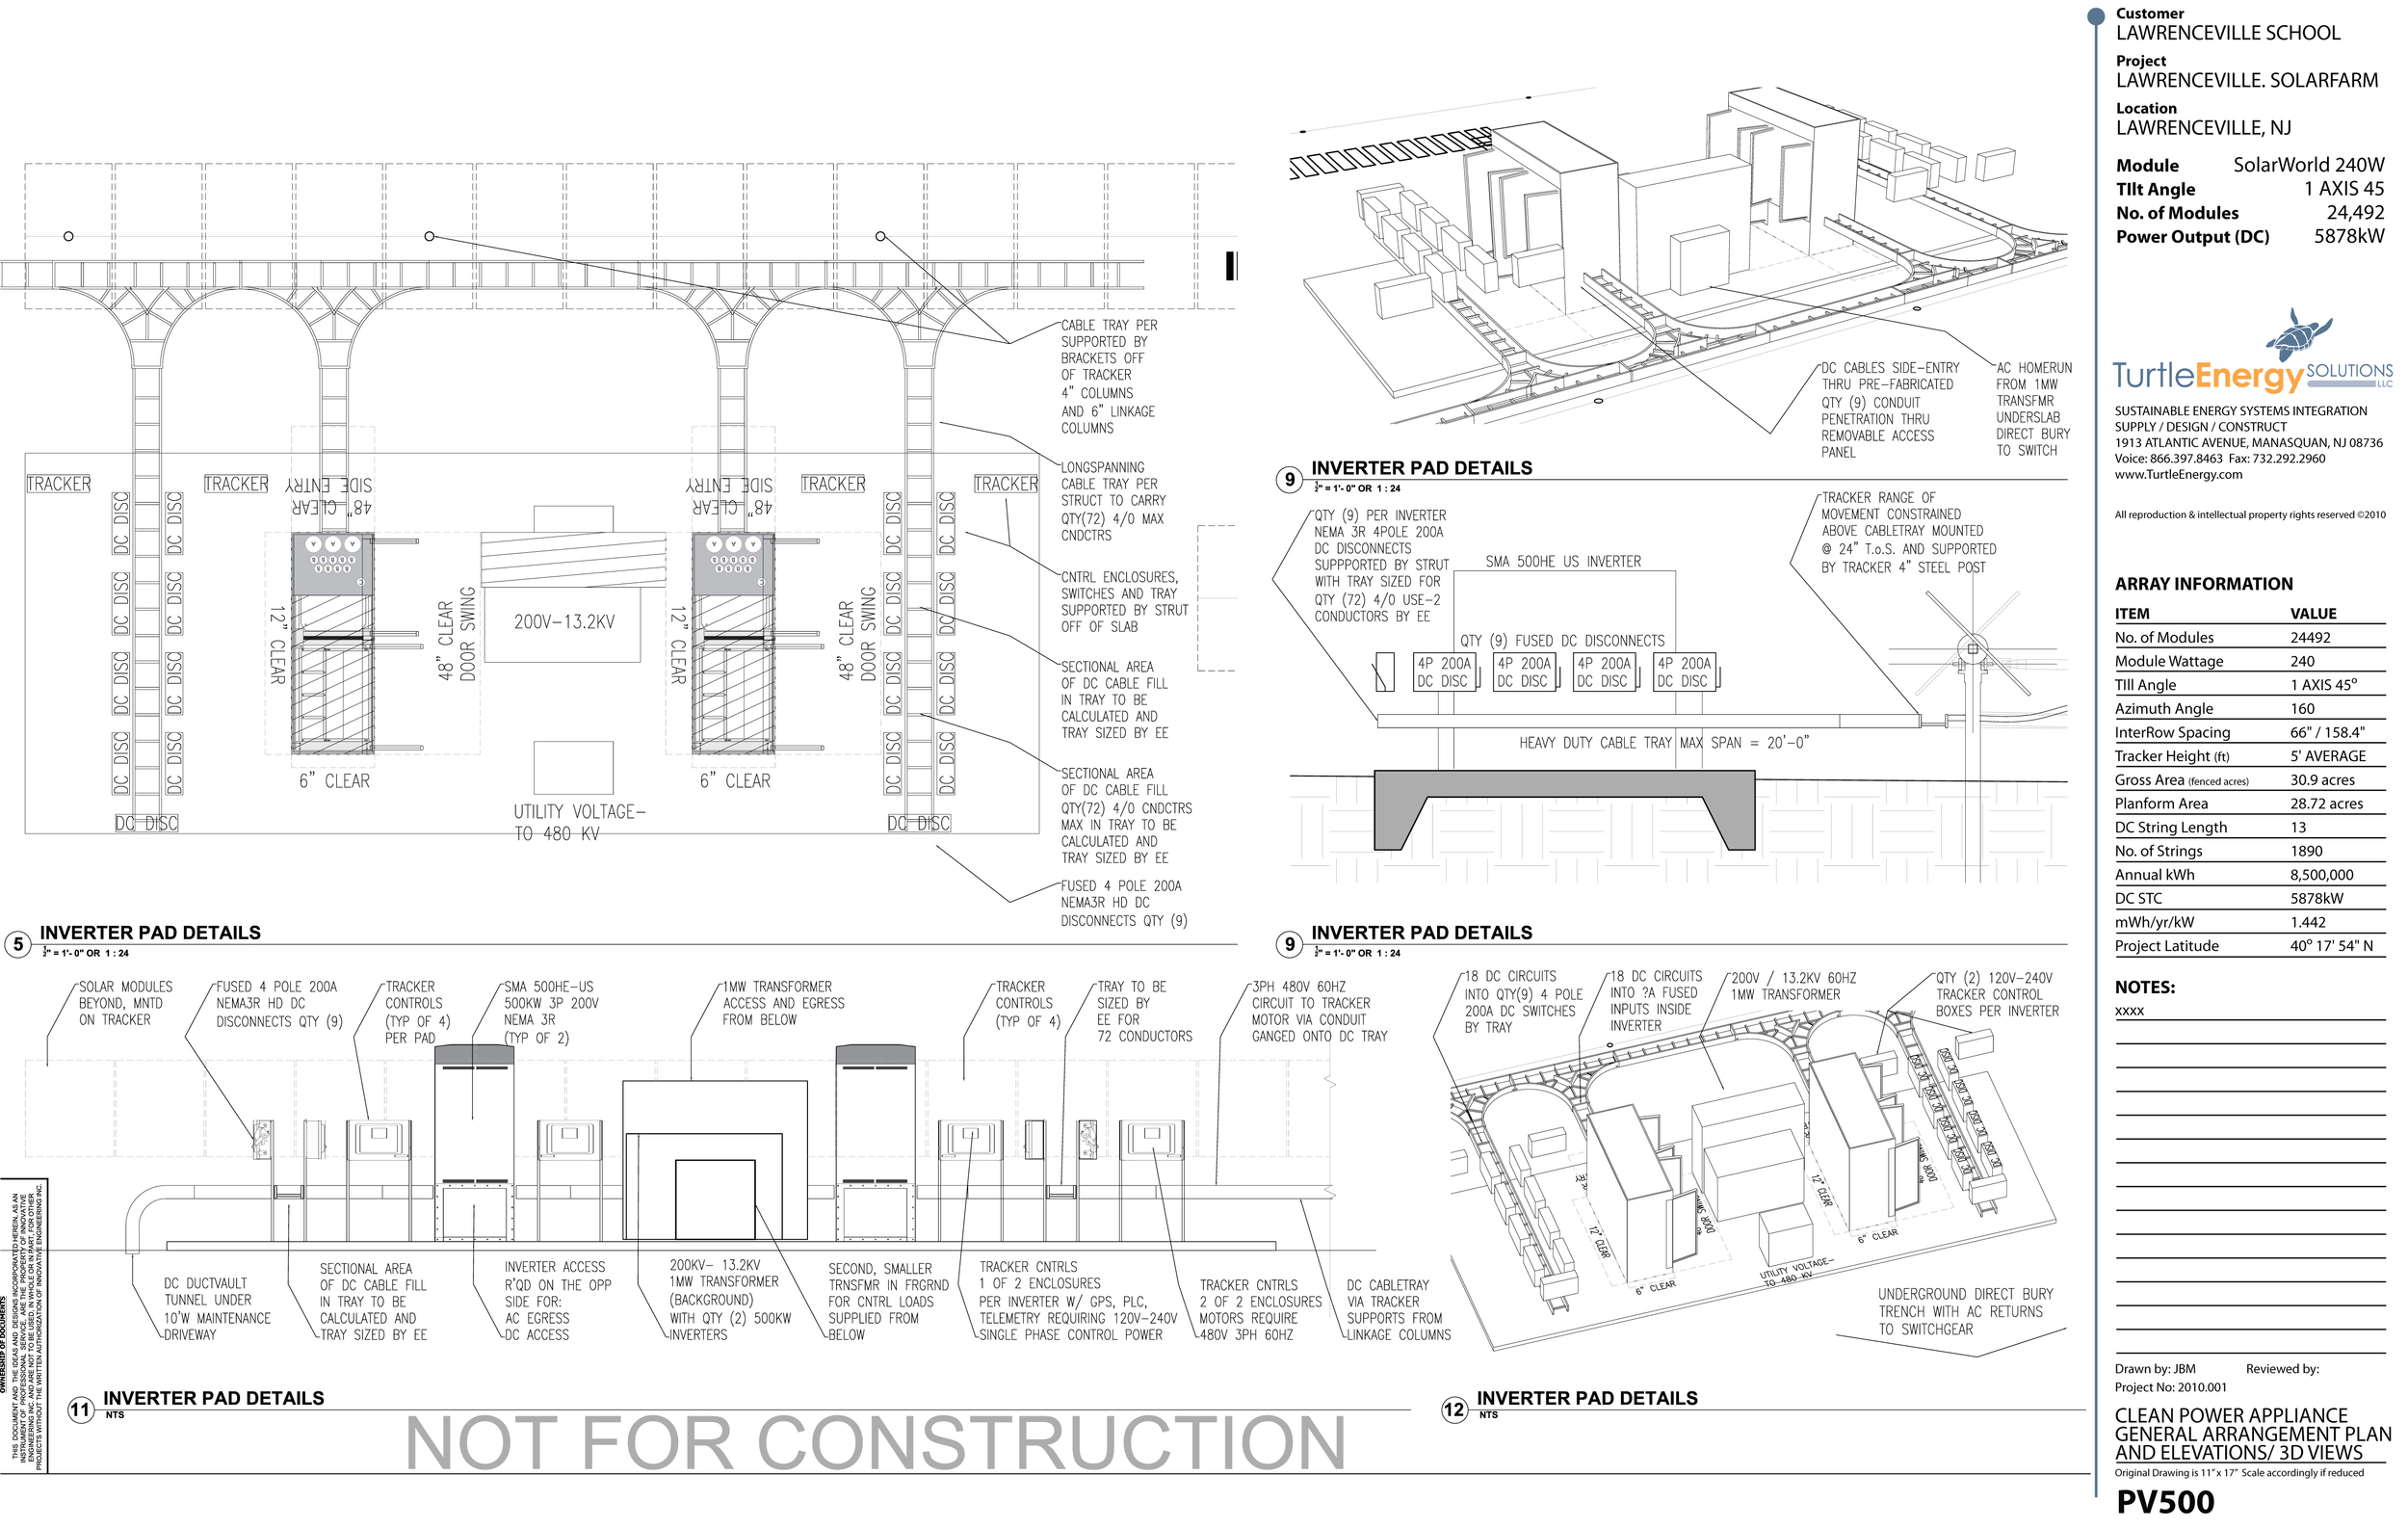
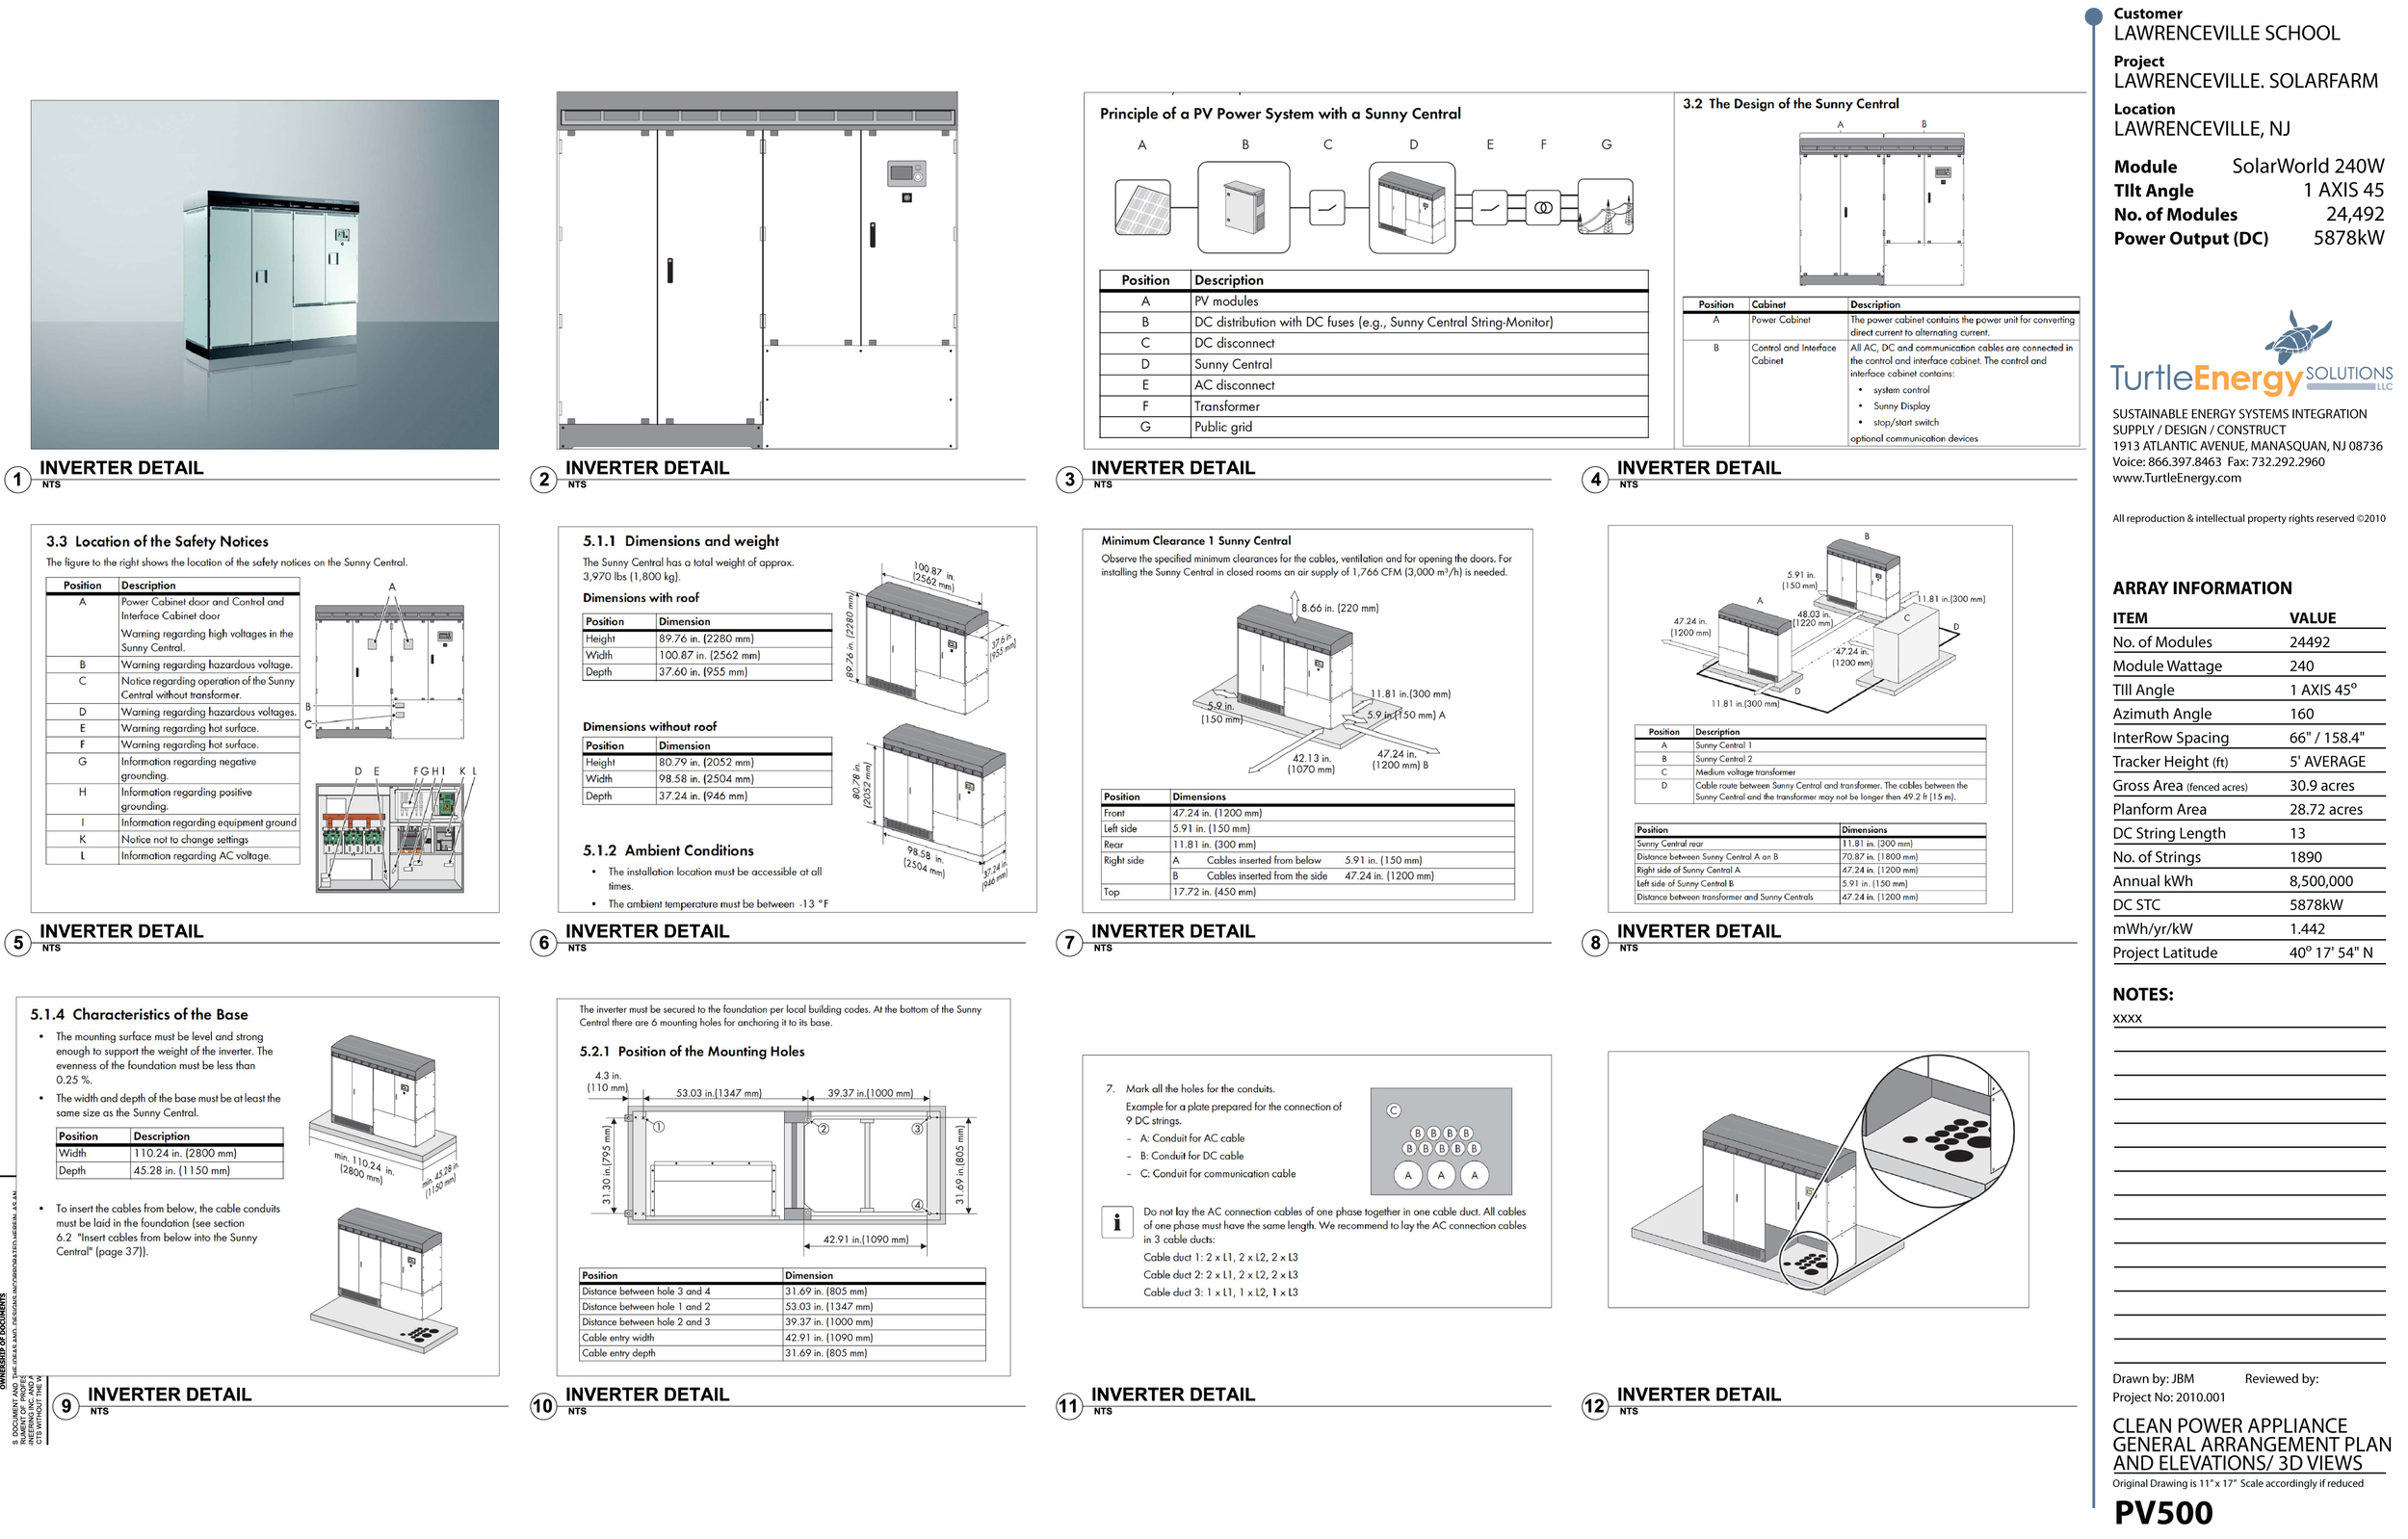
Project: 6MW on thirty acres of single axis trackers, 500kW MV inverters
Cost of project: $28M, Date Energized: May 2012
John Millard's Role- principal in charge/ owner/ primary end user contact.
Civil, environmental, structural, mechanical consultant – Innovative Engineering; Wall, NJ
Permits required- NJDEP; Wetlands LOI, Flood Hazard Applicability Determination. NJ Department of Transportation- Permit to create curb cut on State Road 206. Township of Lawrence Zoning Board- Variance from Environmentally Protected Agricultural Zoning to Commercial Zoning Code. PSE&G interconnection permit, NJCEP SREC permit.
Role by John Millard: 1) Found TurtleEnergy 2003, 2) Sell Company Capabilities to Client in Nov. 2009, 3) Compete with two other companies to win $28M project, 4) Build project team to execute project, 5) Engage and Coordinate Engineering Consultants for Permits, 6) Negotiate Power Purchase Agreement, 7) Provide Due Diligence Design for Lender's Engineer to evaluate and validate for $15M non-recourse financing, 7) Estimate Annual Electricity Production for 20 year Production Guaranty, 8) Evaluate Mounting Hardware solutions for review, 9) Negotiate Procurement Contracts and Project Specific Warranties with Manufacturers of Inverters, Solar Modules, Mounting Hardware and Cable Tray. 10) Lead Site Layout and Subsurface Conduit Route for Permits, 11) Primary Liaison with Client, 12) Primary Legal Negotiator for Developer 13) Expert Witness at Zoning Board of Adjustment Hearing, 14) Negotiate SREC contracts with Load Serving Entities and SREC Brokers.
Project Achieved Zoning Approval in November of 2011 as well as all NJDEP Permits and NJDOT Permits- Project was sold to investors in April of 2011 and construction commenced in October of 2011, energizing in May of 2012 (commercial operations).
Summary:
John Millard was the principal in charge of this $28M solar PV project. Millard introduced the concept of purchasing electricity from an on-site solar project to the school leadership and led the project development as well as the power purchase negotiations. Millard's company, TurtleEnergy, competed against two other utility scale project companies to win the 9000MWh / Year contract and prevailed.
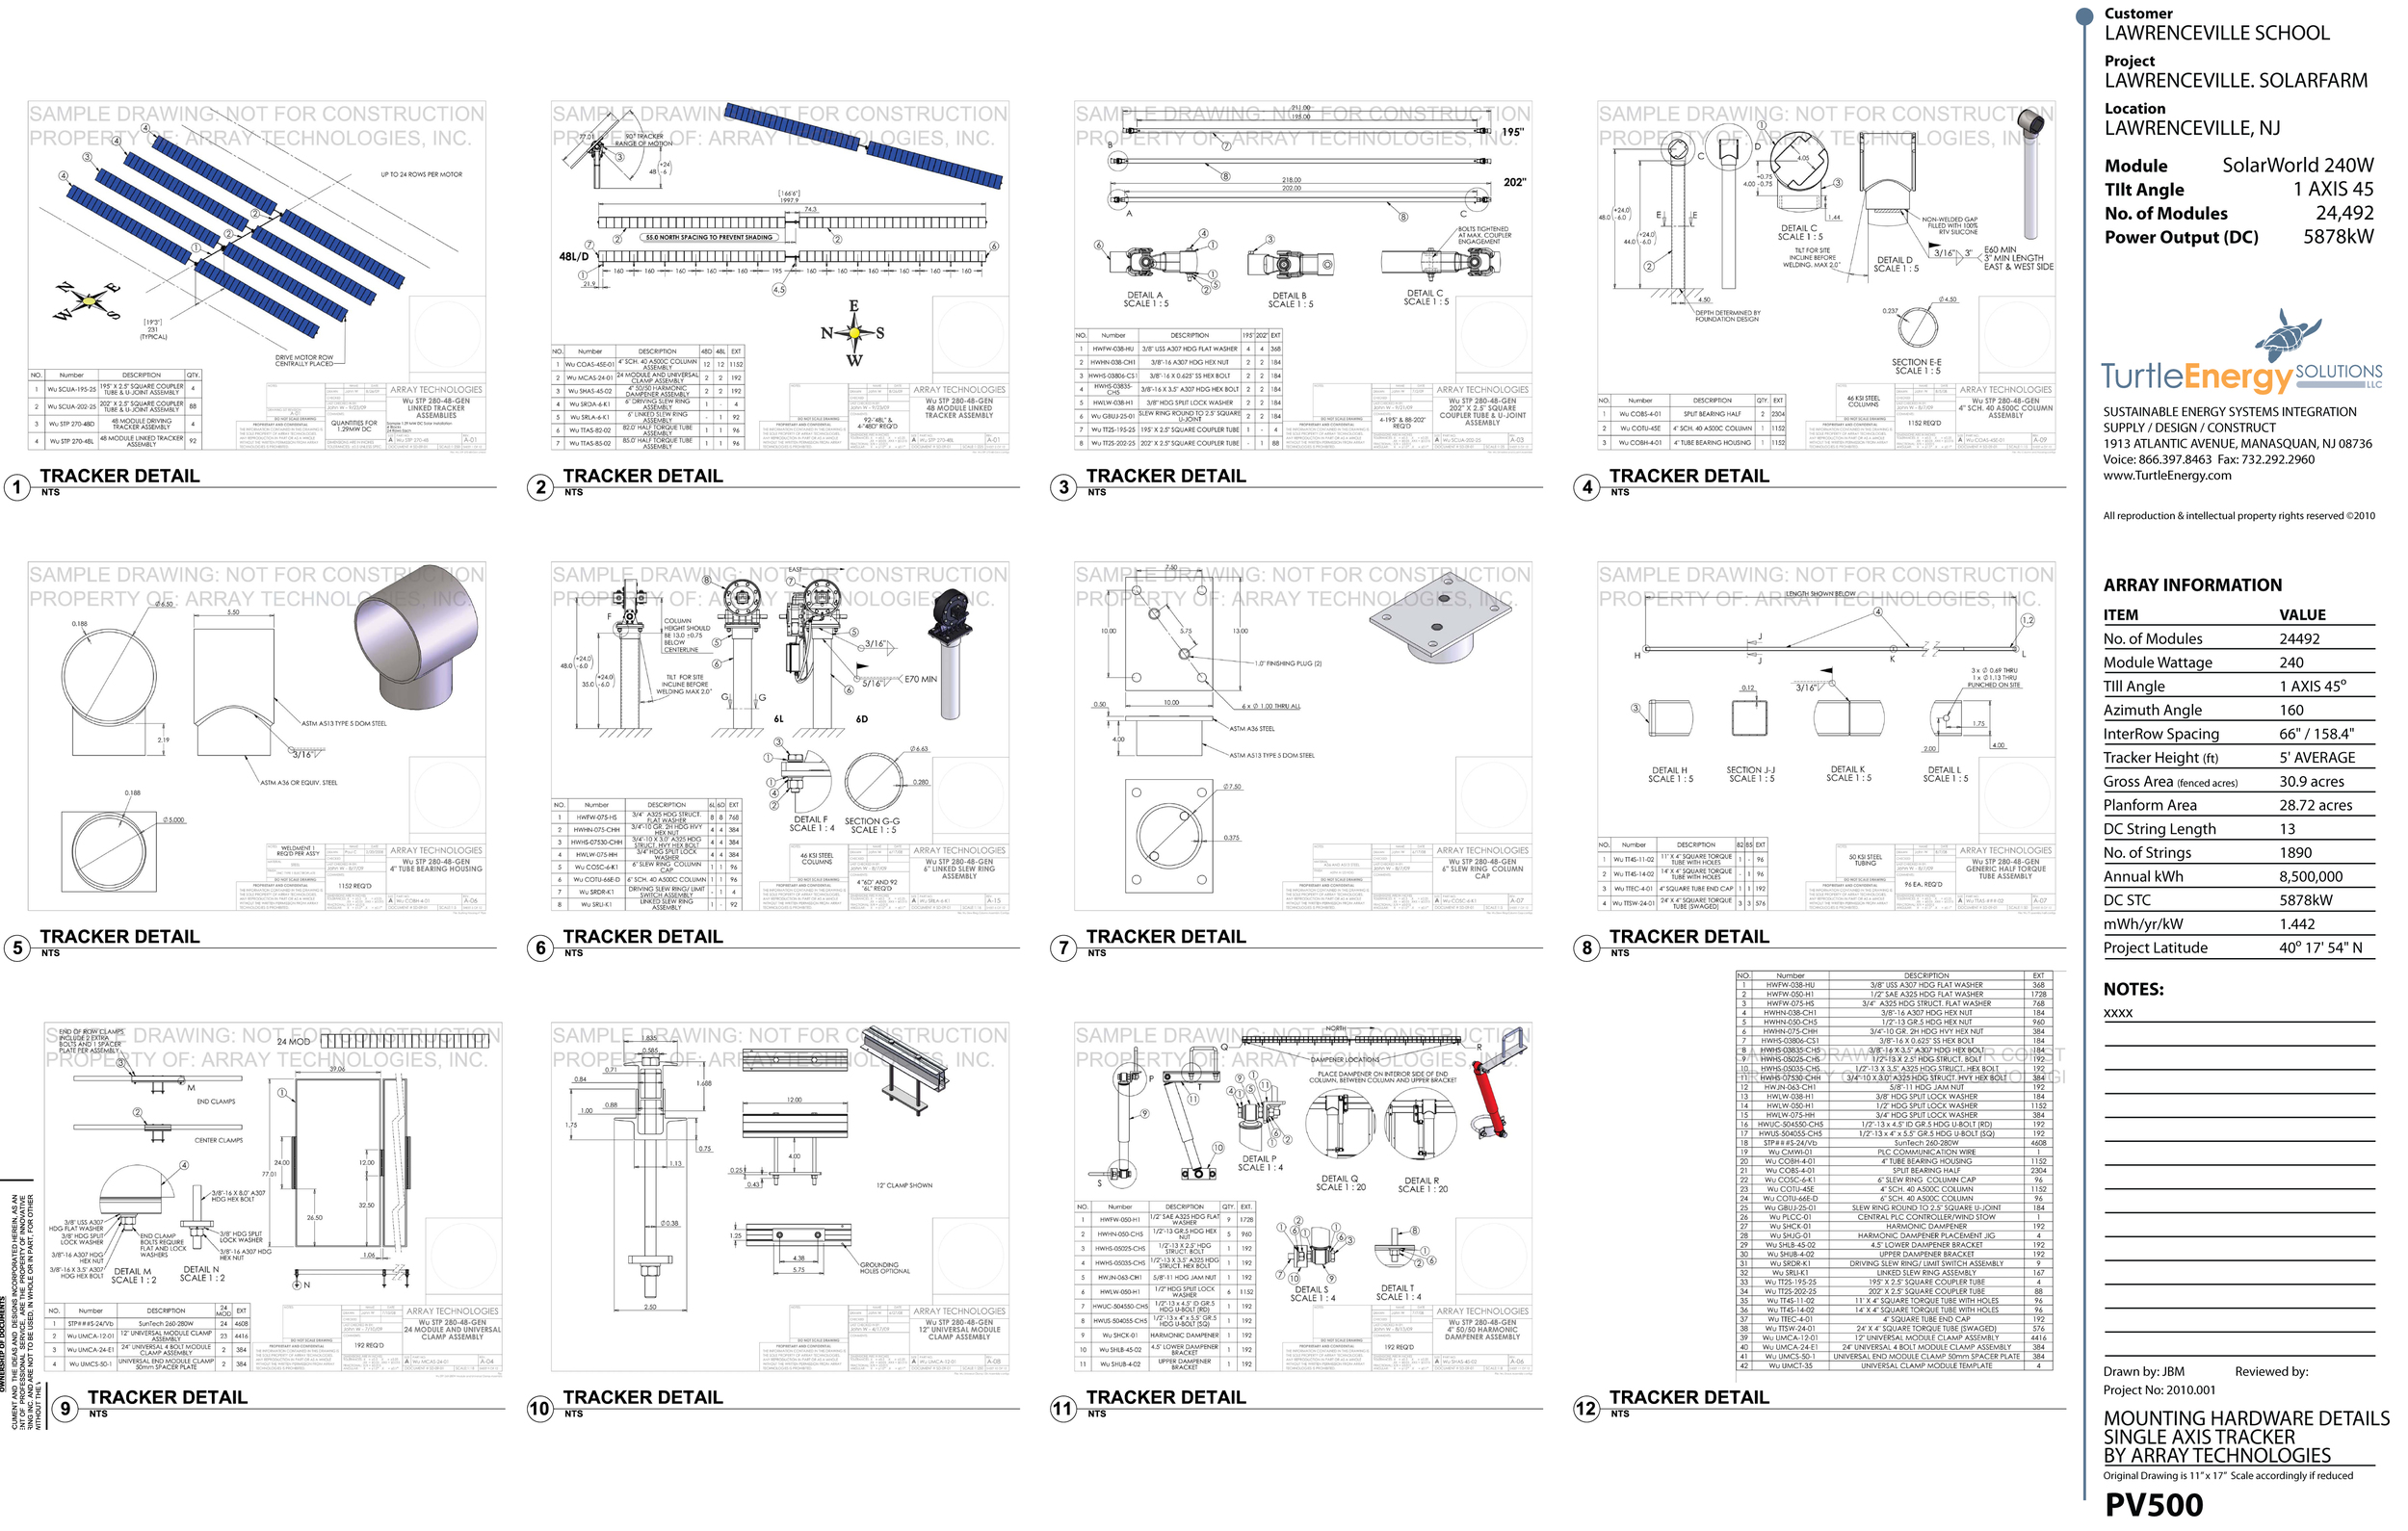
Millard modelled the annual energy production that he forecast for the the project, communicated the intermittent behavior of the system to the utility and complied with the utility goal of constraining the AC output of the system to 5MW. This was accomplished by deploying a single axis tracker from Array Technologies who supplied the project with state of the art mounting hardware. The electrical design of the project, which was sited one half mile from the point of connection, used medium voltage (12.6kV) transformers to step up the native 200V inverter output in order to minimize line losses and to match the voltage that the utility metered power at the site. The school built a new load center for the campus that was coordinated with the solar electrical power requirements prior to the start of the solar project construction.The shovel ready 6MW solar project was then sold to a private power producer who provided the $28M fund to construct the project.
Design Development of The Lawrenceville Solar Project:
The design development phase of the Lawrenceville solar project began as soon as our proposal to the Lawrenceville school was accepted by the committee who was evaluating proposals from three separate solar energy companies. We were notified by the school at Thanksgiving time in 2009 that our proposal had been successfully excepted and that we would now begin the process of negotiating the power purchase contract with the school's attorneys. The primary agreement was determining the price that electricity would be sold to the school from this solar energy system. While we had presented three different options to the school for generating electricity from various types of solar energy systems, the school preferred The single axis tracker option because of the reduced number of solar panels that it would require to generate the same amount of electricity as a solar panel mounted on a fixed tilt system. To representatives of the school the single axis tracker was a balance between the power dense nature of the fix tilt system and the space hungry nature of the dual axis tracker solution. The single axis tracker system would cover approximately the same 30 acres that the fixed till system would require, but it would do so using less solar panels and with a lower ground coverage ratio. This meant that the ground beneath the solar panels would still receive a certain amount of skylight that would enable the agricultural land occupied by the solar project to be rotated out of production of barley and allowed to grow naturally occurring ground covered that would help to restore nutrients to the soil over the 20 year period during which the land would be deployed as a solar farm. This would not be possible with a fixed tilt system largely due to the mechanical nature of the till tracks that would be constructed and the solar panels would not allow sufficient amount of skylight to reach the ground plane in order to allow plants to grow underneath the solar panels. There is far less superstructure underneath the single axis tracker mechanism that there is underneath the till track of a fix tilt solar energy system. The civil engineer involved in the Lawrenceville project presented a range of plant species that would be suitable to grow under the single axis trackers and yet would require a minimum amount of mowing. Lawrenceville engaged a sustainability consultants who recommended wildflowers that would sustain many colonies of bees that could be located in hives at the site. It was thought that by cultivating honeybees at the site and growing forage under the single axis trackers that the school might be able to retain its agricultural assessment for tax purposes at the local level.
Hence the schematic design agreed-upon at the turn of the year in 2009 was a 30 acre land deployment of single axis trackers mounted single module in portrait orientation with a .5 ground coverage ratio, with vegetative ground cover inside the fence that would be suitable for honeybee forage, and that the design should require The minimum amount of excavation of the agricultural land so as not to disturb the topsoil across the 30 acre parcel. The exact method of power distribution and the types of inverters and the size of the housekeeping pads and other detailed aspects of the design would be solved during the periods of time during which the power purchase agreement would be negotiated to hammer out the details of the production guarantee, the land lease, termination defaults, and many other specific terms that would be determined over the eighth month that it required to negotiate the power purchase agreement. These terms and many of the detailed design considerations of the solar project would be resolved during the design development phase of the project.
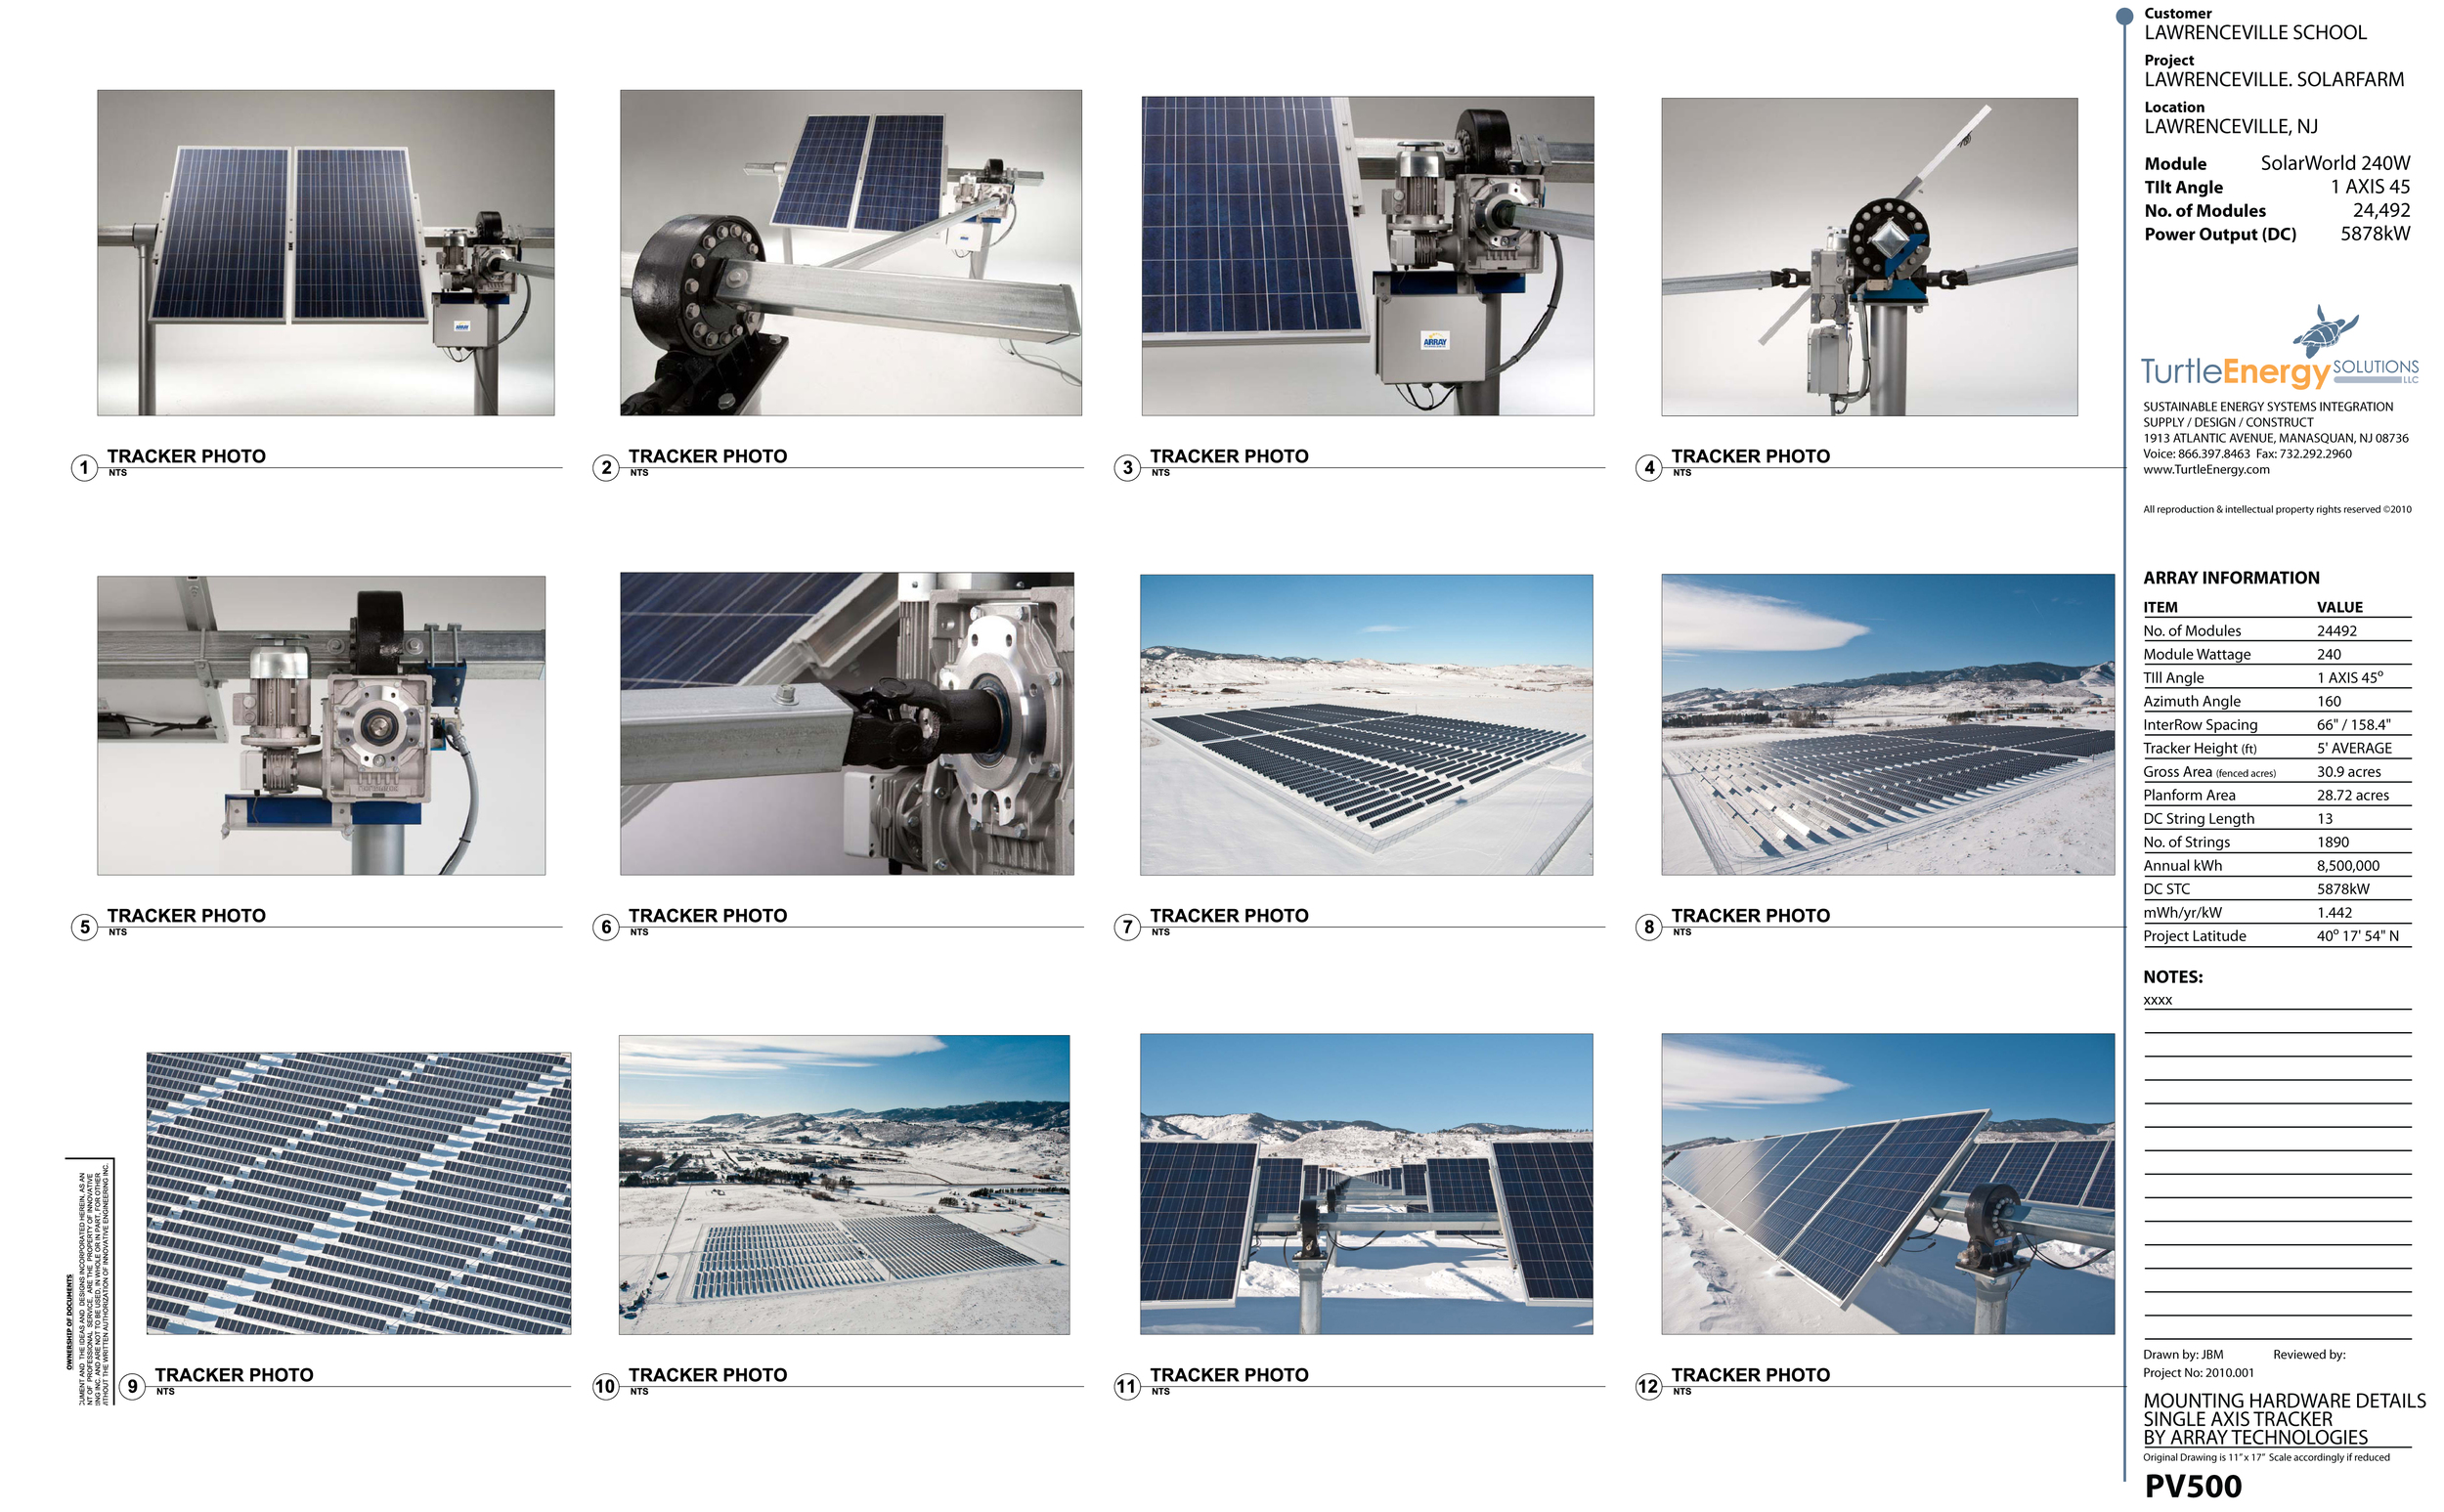
In early 2010 the selection of a manufacturer for the single axis tracker to be deployed at the Lawrenceville project was the first priority. Within the family of single axis tracker manufacturers there are a couple of distinguishing fundamental attributes that one became familiar with the first being what method of actuation was deployed in order to move the solar panels. This boils down to essentially two methods- central actuation and distributed actuation. What this means is that some single axis tracker manufacturers deploy a smaller, separate motor to drive movement on each separate group of solar panels numbering 20 or less. Other manufacturers deploy a larger, central motor to drive movements on each separate group of solar panels numbering 200 or more. Each manufacturer claims merit for each philosophy – distributed actuation manufacturers claim that by distributing many smaller motors across a single axis tracked solar project that there is less risk of a motor failing and causing a loss of energy to the project. Central actuation manufacturers claim that the motor that they deploy to drive 200 or more solar panels is vastly under-employed compared to applications for which that larger motor was designed. They maintain that their larger motor is reliable and durable – with demonstrated failure mode analyses with an acceptably low risk of failure. Those companies predisposed to central actuation, also point to the fact that each motor requires a supply of AC electricity usually 120 V. This requirement vastly increases the electrical scope of work for any distributed actuation solar project. Larger, centrally actuated motors require only one AC power supply for one motor where as a distributed actuation project would require 10 times as many power supplies. Many people think that the electricity for these smaller motors can come from the solar power- and that is a misconception. Even if it were true, it would still represents a significant increase in labor to wire a separate motor for every 20 solar panels on the project. Another challenge of having 10 times as many motors on a tracker project is the fact that you then also must design for 10 times as many separately moving torque tubes. It stands to reason that if you have one motor driving one tortilla to rotate from morning tonight that the torque tube must then be independent of other rotating torque tubes that are driven by separate motors. This aspect to distributed actuation is perhaps the most agree just design feature because each separately moving torque tube must be supported by a separate structure. While this may at first not seem to be a major liability of the design, it soon becomes evident on a project where there is even the slightest change in grade over distance that each structure causes a redundancy in the number of peers that are required to adjust for the change in grade. A centrally actuated torque tube can be infinitely long and is limited in length only by the strength of the motor. Since there is only one torque tube that is being rotated by this motor, this torque tube can continue to slope with the ground and be housed within an infinite number of viscous couplings that are simple to support, inexpensive, and commonly found on the shelves of hardware suppliers. Only the strength of the motor limits the length of the torque tube thereby eliminating any need for number of articulate joints required to separate disparate moving torque tubes required by distributed actuation tracker projects. Finally, in order to monitor the functionality of each separate motor, a exponential increase in the amount of communications electronics required to monitor those motors is required with distributed actuation tracker projects. Therefore, distributed actuation projects require separate AC power supplies for each motor, separate communications for each motor, separate mechanical structures to support each separately rotating torque tube and separate, distinct motors each having its own maintenance requirements and failure mode.
Our company discovered all of these attributes of each actuation philosophy by visiting manufacturers in the United States. We embarked on this mission thinking that distributed actuation was the preferable strategy. We returned from this mission convinced that central actuation was by far the cheapest and simplest solution to moving solar panels in the sun. Reaching this conclusion was the source of a great deal of consternation on our project team. Some thought that by doing diligence on these mechanical systems – we were demonstrating a knowledge blind spot that disqualified us from determining how to design the solar project. Naturally these members of senior management including exclusively finance related team members declared that the solar project should become a fixed tilt design and that the single axis tracker effort should be abandoned. According to them, the moving parts factor was already beginning to sabotage our solar project! A strengths, weaknesses, opportunities and threats (SWOT) analysis was then initiated by our team to put to death the debate about fixed versus tracked solar once and for all. Bottom line, a fixed tilt system would require 15% more solar panels, more mounting hardware, more inverters, and more land than a single axis tracker that produced the same amount of electricity per year. This metric was undeniable and despite that, the finance team persisted in their preference for a fixed tilt system and engaged in politics to achieve that outcome. A board meeting of the parent company was convened and concerns expressed about the "moving parts factor" of the $28 million project. The additional cost of building 15% more project was presented to the board as an acceptable cost in order to reduce the risk that the single axis tracker might not move properly. A financial wizard was deployed with pro forma spreadsheet to show how these additional costs could be "present valued" or amortized over the 20 year term of the power purchase agreement. Senior management omniscience pervaded this discussion, there was also a dismissal of the concerns that the larger, fixed tilt design would violate the utility's 5 MW AC cap resulting in the shedding of 150 peak hours of production per year- a loss of significant amount of electricity in order to comply with the utility's directive. After the meeting, the board members all hopped into their cars – each with hundreds of moving parts and drove to lunch.
Ultimately, the single axis tracker was adopted as the basis of design for the Lawrenceville solar project. The centrally actuated tracker manufactured by Array Technologies of Albuquerque, New Mexico was chosen as the preferred solution. This outcome was the result of several closed-door "seminars" with senior management that properly examined the due diligence exercise that created a rational, process of elimination of the distributed actuation trackers, presented third party failure mode analysis by Black & Veach, recommended quantities of attic storage parts and their cost, as well as the history of successful single axis tracker projects by Array Technologies of Albuquerque, New Mexico. Subsequently, disaffected finance team members left the company and the project over their fears of moving parts. At the time of writing, the project has been in service for over two years. The project has survived two hurricanes with minimal disruption caused only by the discontinuation of electrical service from the utility for a period of 10 days during hurricane Sandy. Excessive snowfall during these two years of 2013 and 2014 has demonstrated the superior performance of the single axis tracker during winter months with the ability to tilt the solar modules by 45°, thus causing the snowfall to be removed from the solar panels at discretion. Similar fixed tilt systems in the region continued to be covered by residual snowfall for a period of weeks, resulting in a significant loss of electricity. This unanticipated benefits of being able to control the angle of tilt was discovered in early 2013. Both the Lawrenceville School and the owner of the solar project are very happy with the decision to build a single axis tracker instead of a fixed tilt solar project.
Design development issue: How to get the electricity from the farmland to the campus across 2500 feet of golf course and wetlands.
Short answer: Directional drilling and lots of SEPA permitting.
The obstacles that were thrown at the project were sometimes self-inflicted and other times inflicted by regulatory issues well defined by the State of New Jersey's State Environmental Protection Act. There were not only wetlands that separated the agricultural field (where the solar project was to be cited) from the campus electrical load center, nearly 1/2 mile away, but there was also a small lake that directly interfered with the electrical umbilical that would travel underground from point a to point b. This threat was exacerbated by early advice given by the consulting civil engineer for the project that we would be able to daylight the cable across an existing footbridge that traversed the stream that discharged from this small lake. Months later in the project, the civil engineer discovered that the entire area surrounding the lake was also classified as a wetland – traversable only by using directional drilling.
Directional drilling, a technology perfected by the oil and gas industry – has now been adopted by the electrical contracting industry to solve for difficult trenching conditions. In this case, an ecologist was employed to survey the elevation of the freshwater stream that was the epicenter of the wetland. This survey helped to determine what, if any, flood hazard applicability determination should be assessed for this site. While flood hazard applicability does not affect the method of trenching or directional drilling, it does affect the long-term integrity of the trench if it is to be affected by rising water. Therefore it was a combination of the extent of the wetlands species that were discovered on the site as well as the extent of the floodplain that was calculated by the hydrology engineers engaged by the project that determined how many feet of directional drilling was required to evade the obstacle presented by the wetland. In the end, a directional drilling run of 550 feet was required to travel under the wetland and the floodplain in order to be considered a negative determination of impact. This 550 foot tunnel beneath the lake also preserved the golf course and other landscape that was environmentally sensitive to trenching. The flood hazard applicability determination permit was launched with the state of New Jersey at the end of April 2010 and was not permitted until early August 2010. Meanwhile, the power purchase agreement negotiations between the parties was still not complete. Costs to complete all of the manufacturing due diligence as well as the environmental permits for the project were accumulating into a seven-figure number.
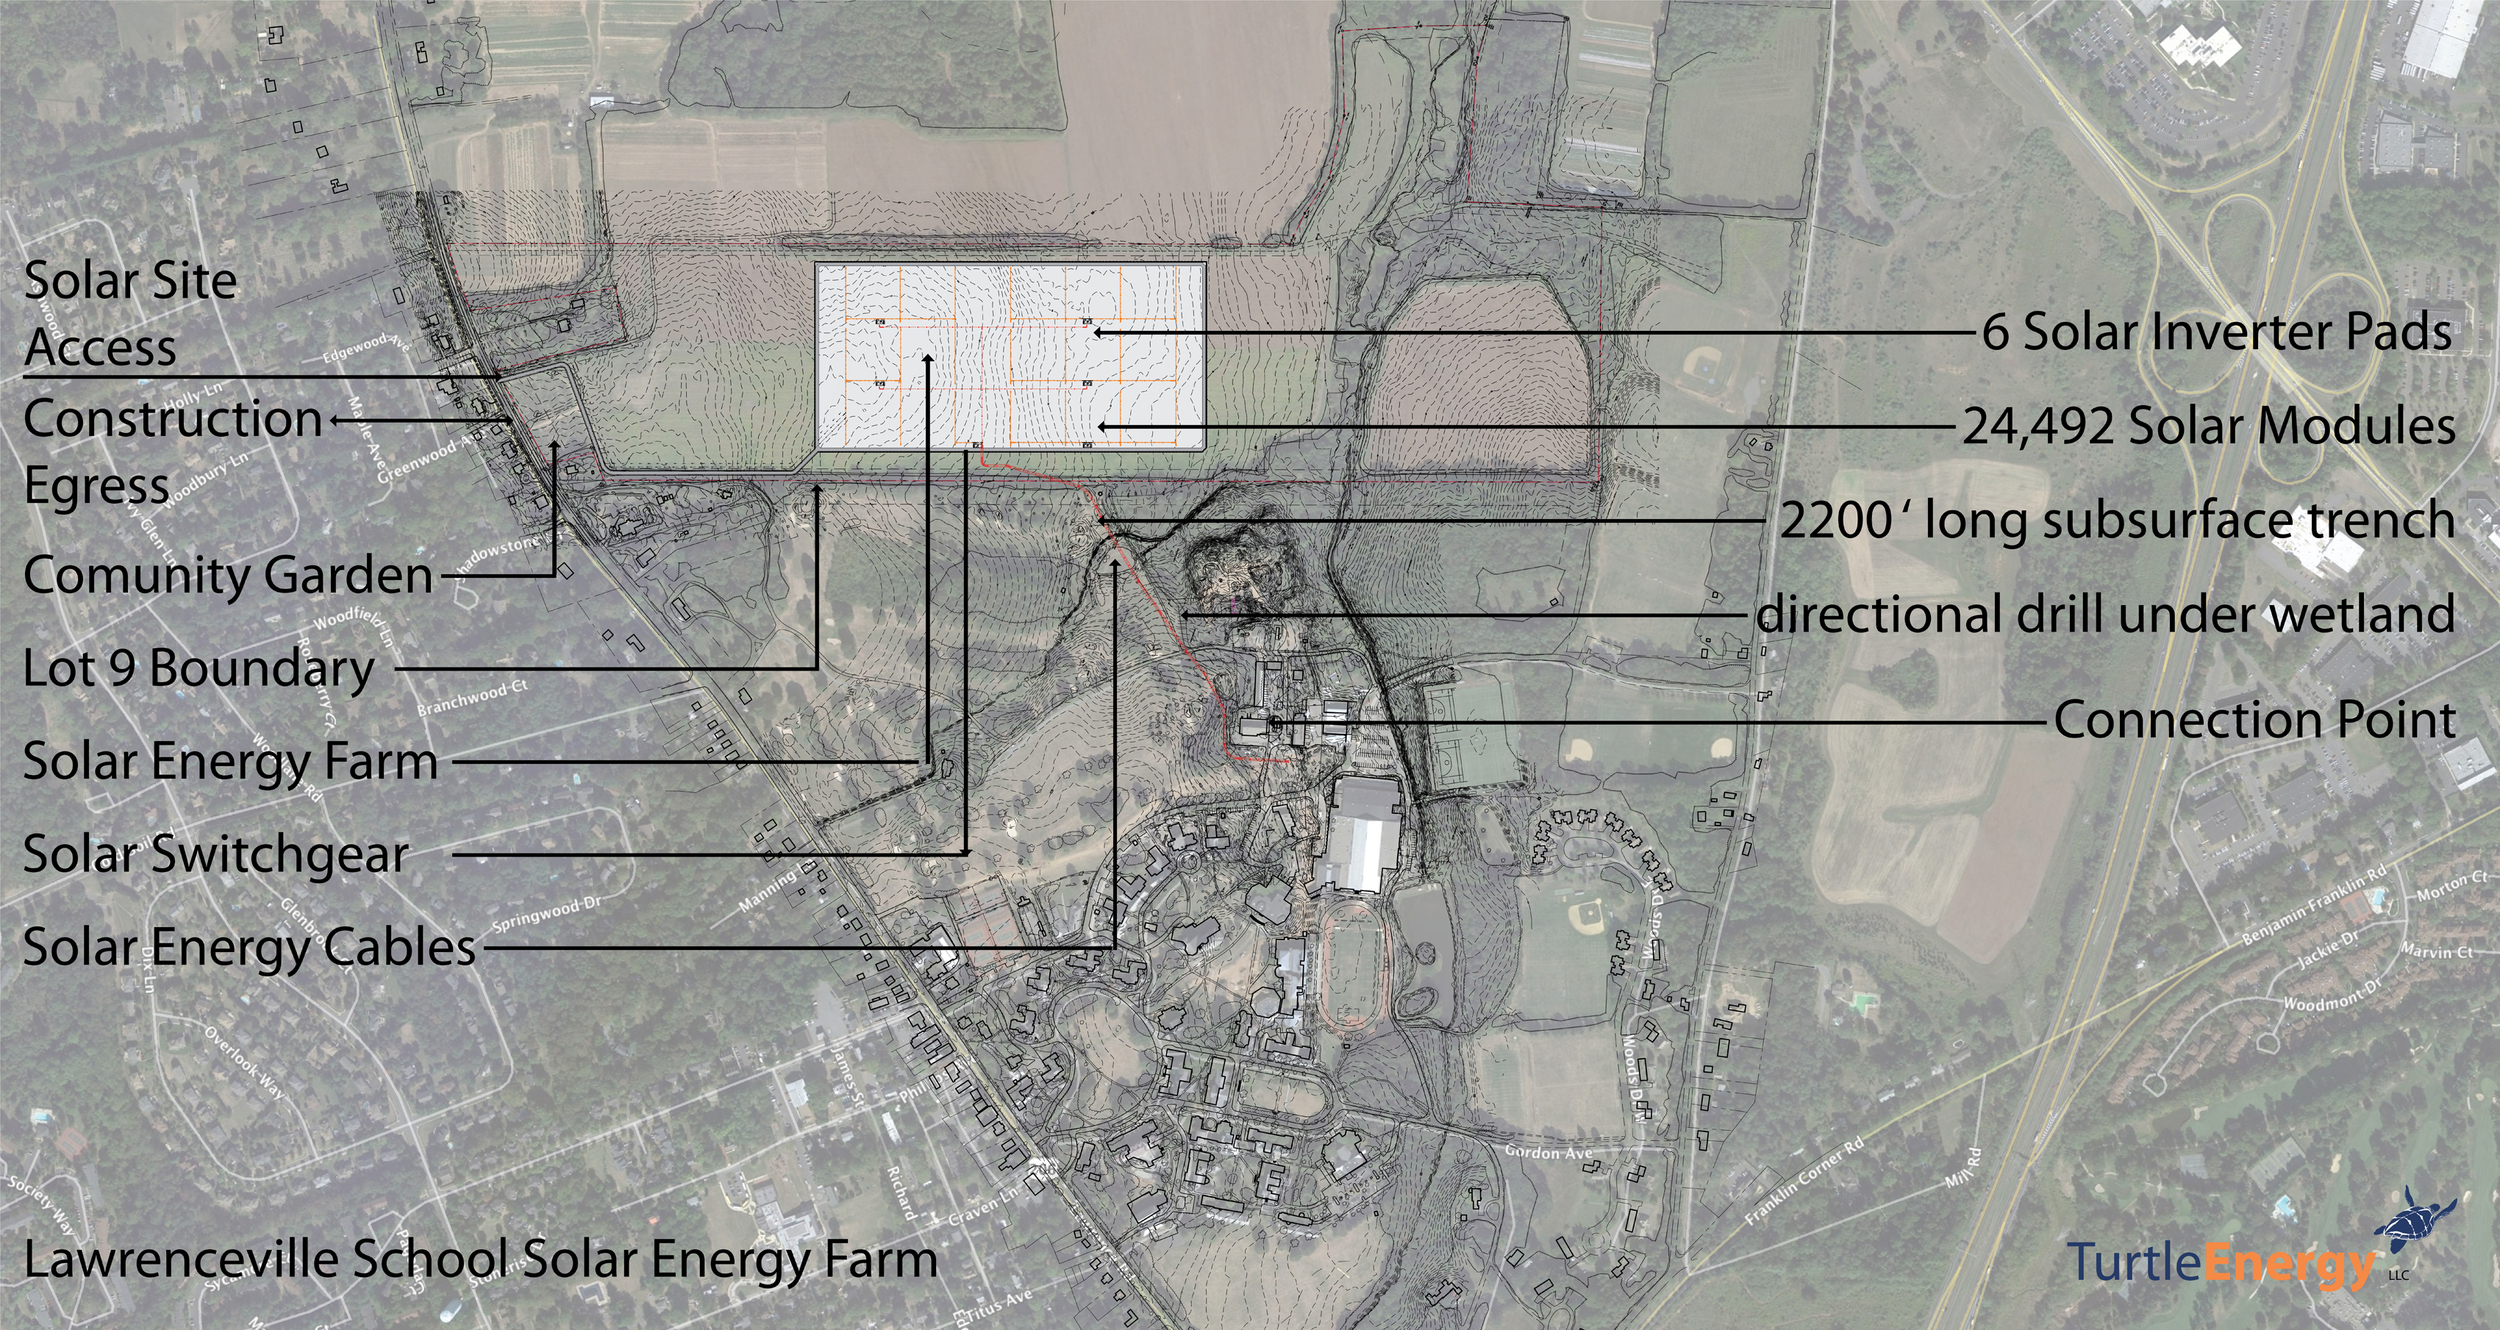
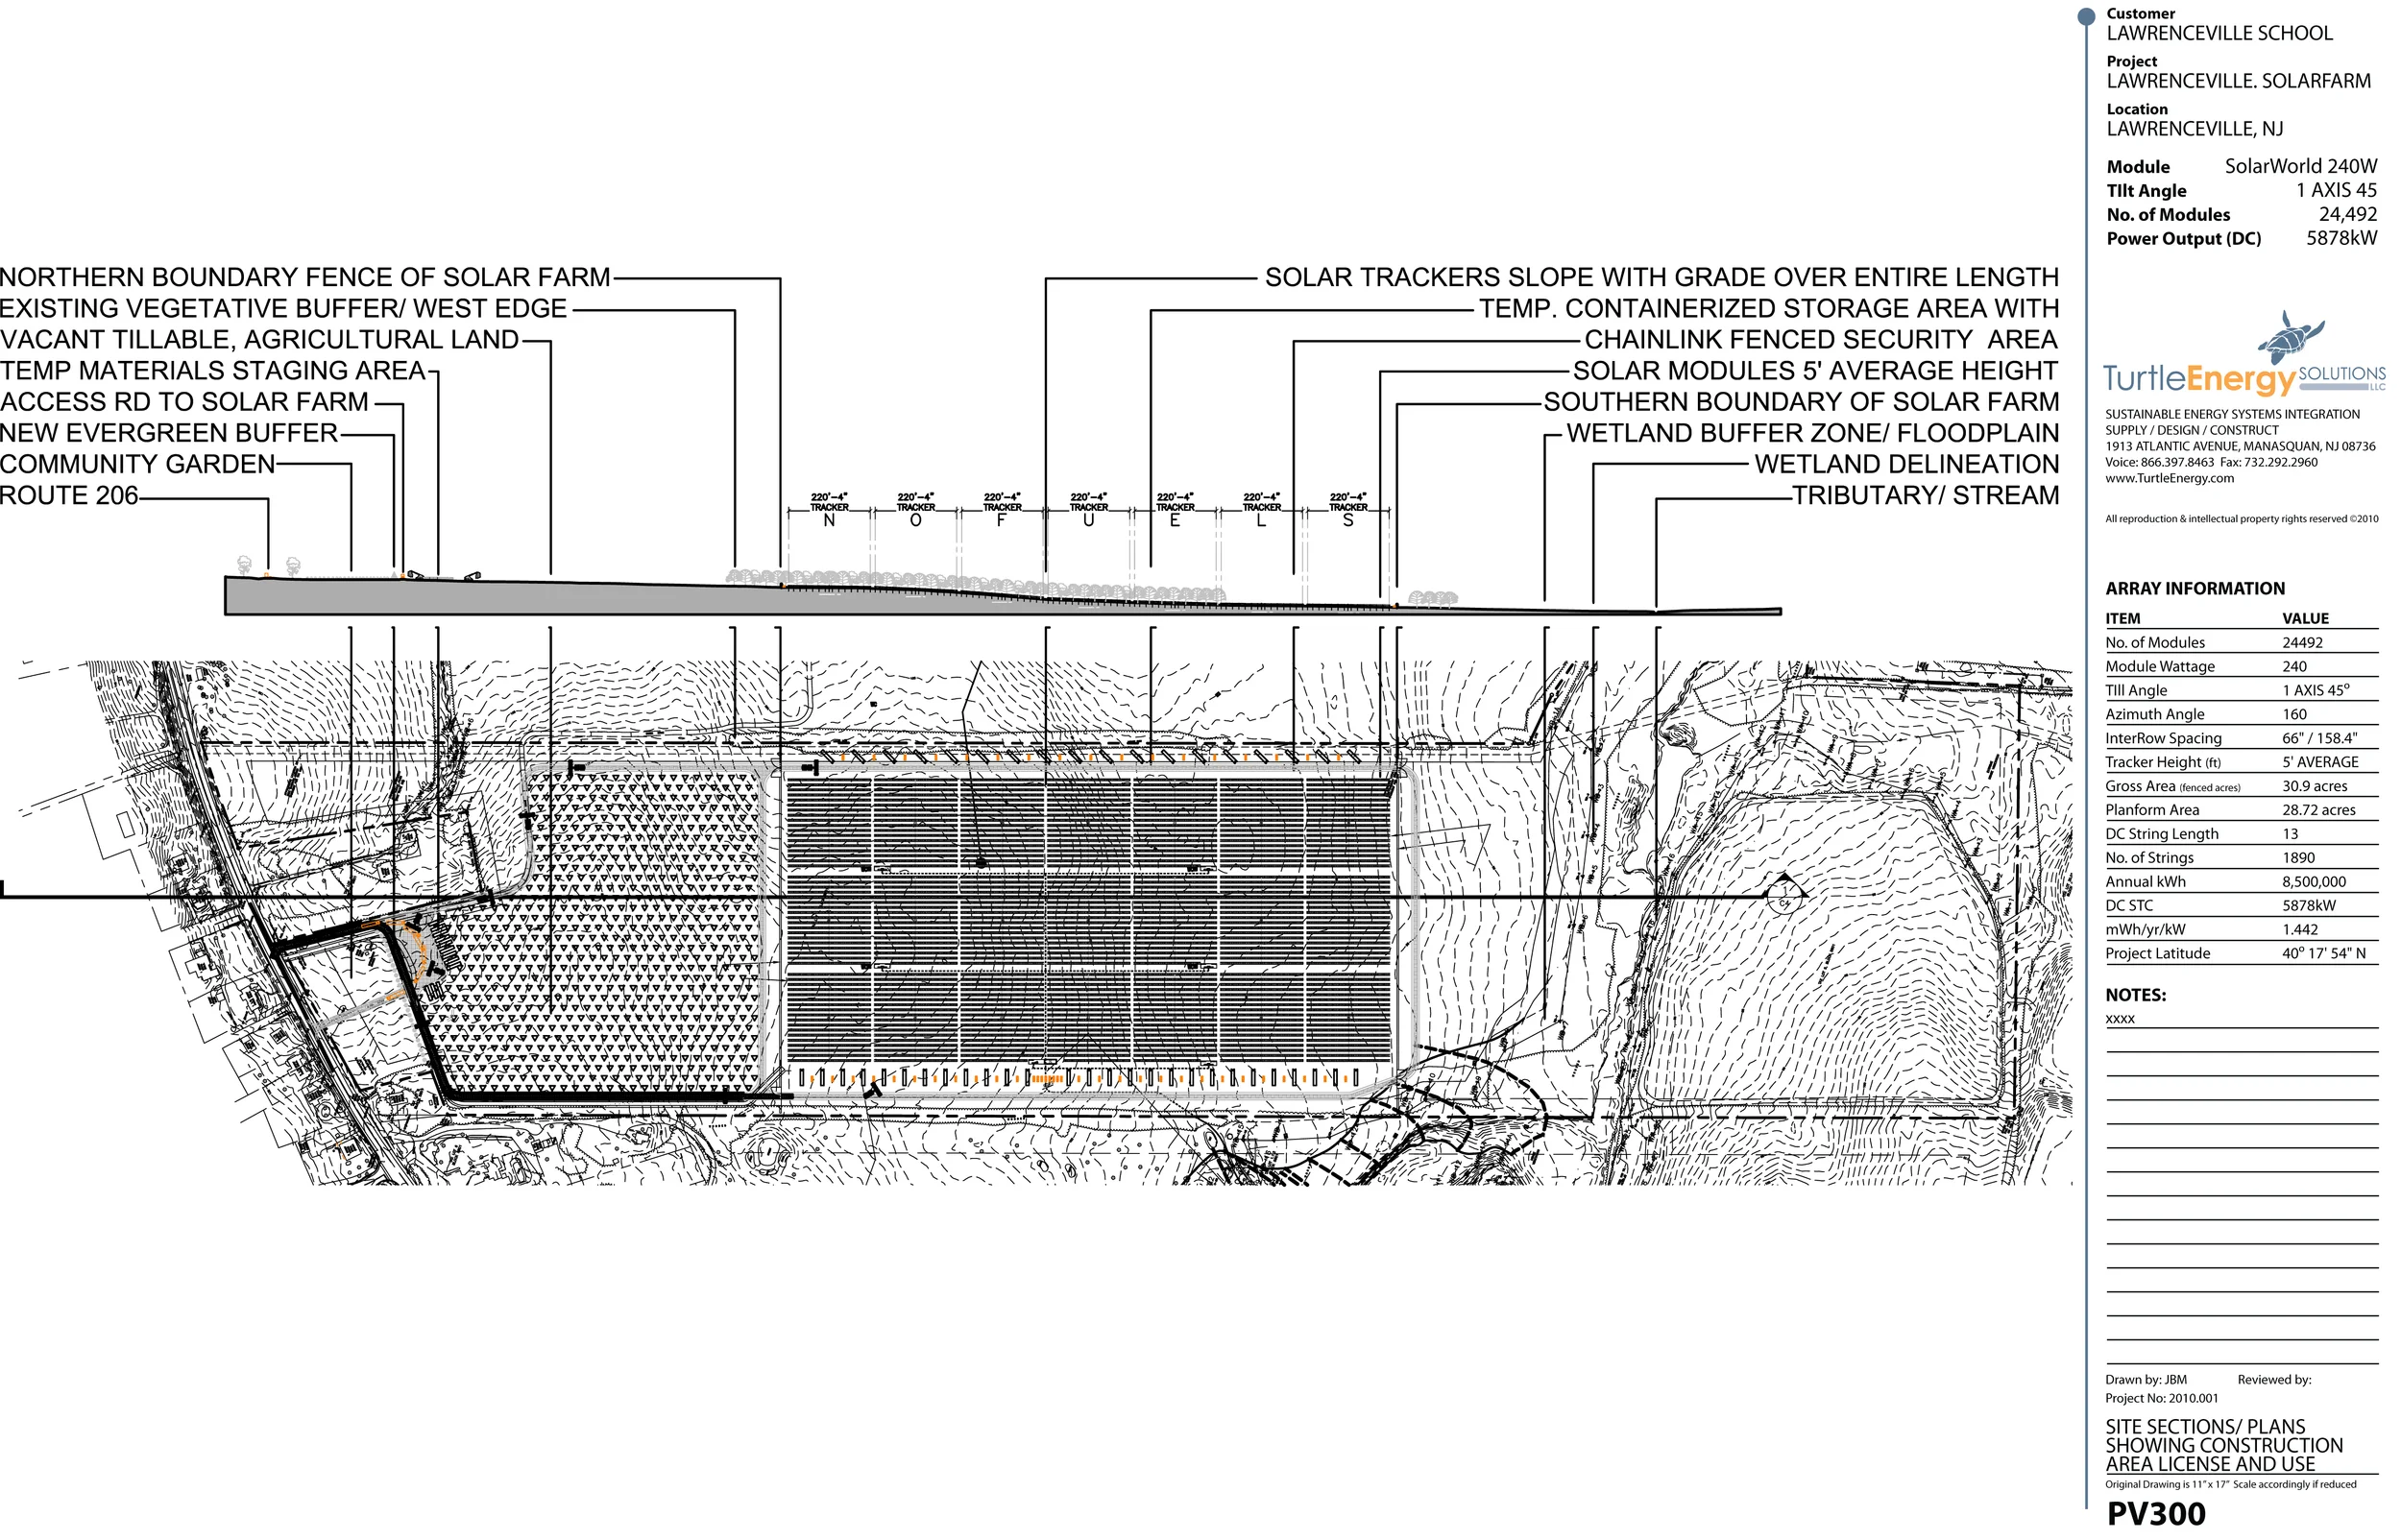
Zoning Illustration 1: Plan shows basic metrics of the project including number of inverter pads, solar modules, length of underground electrical connection, pad mounted switchgear and
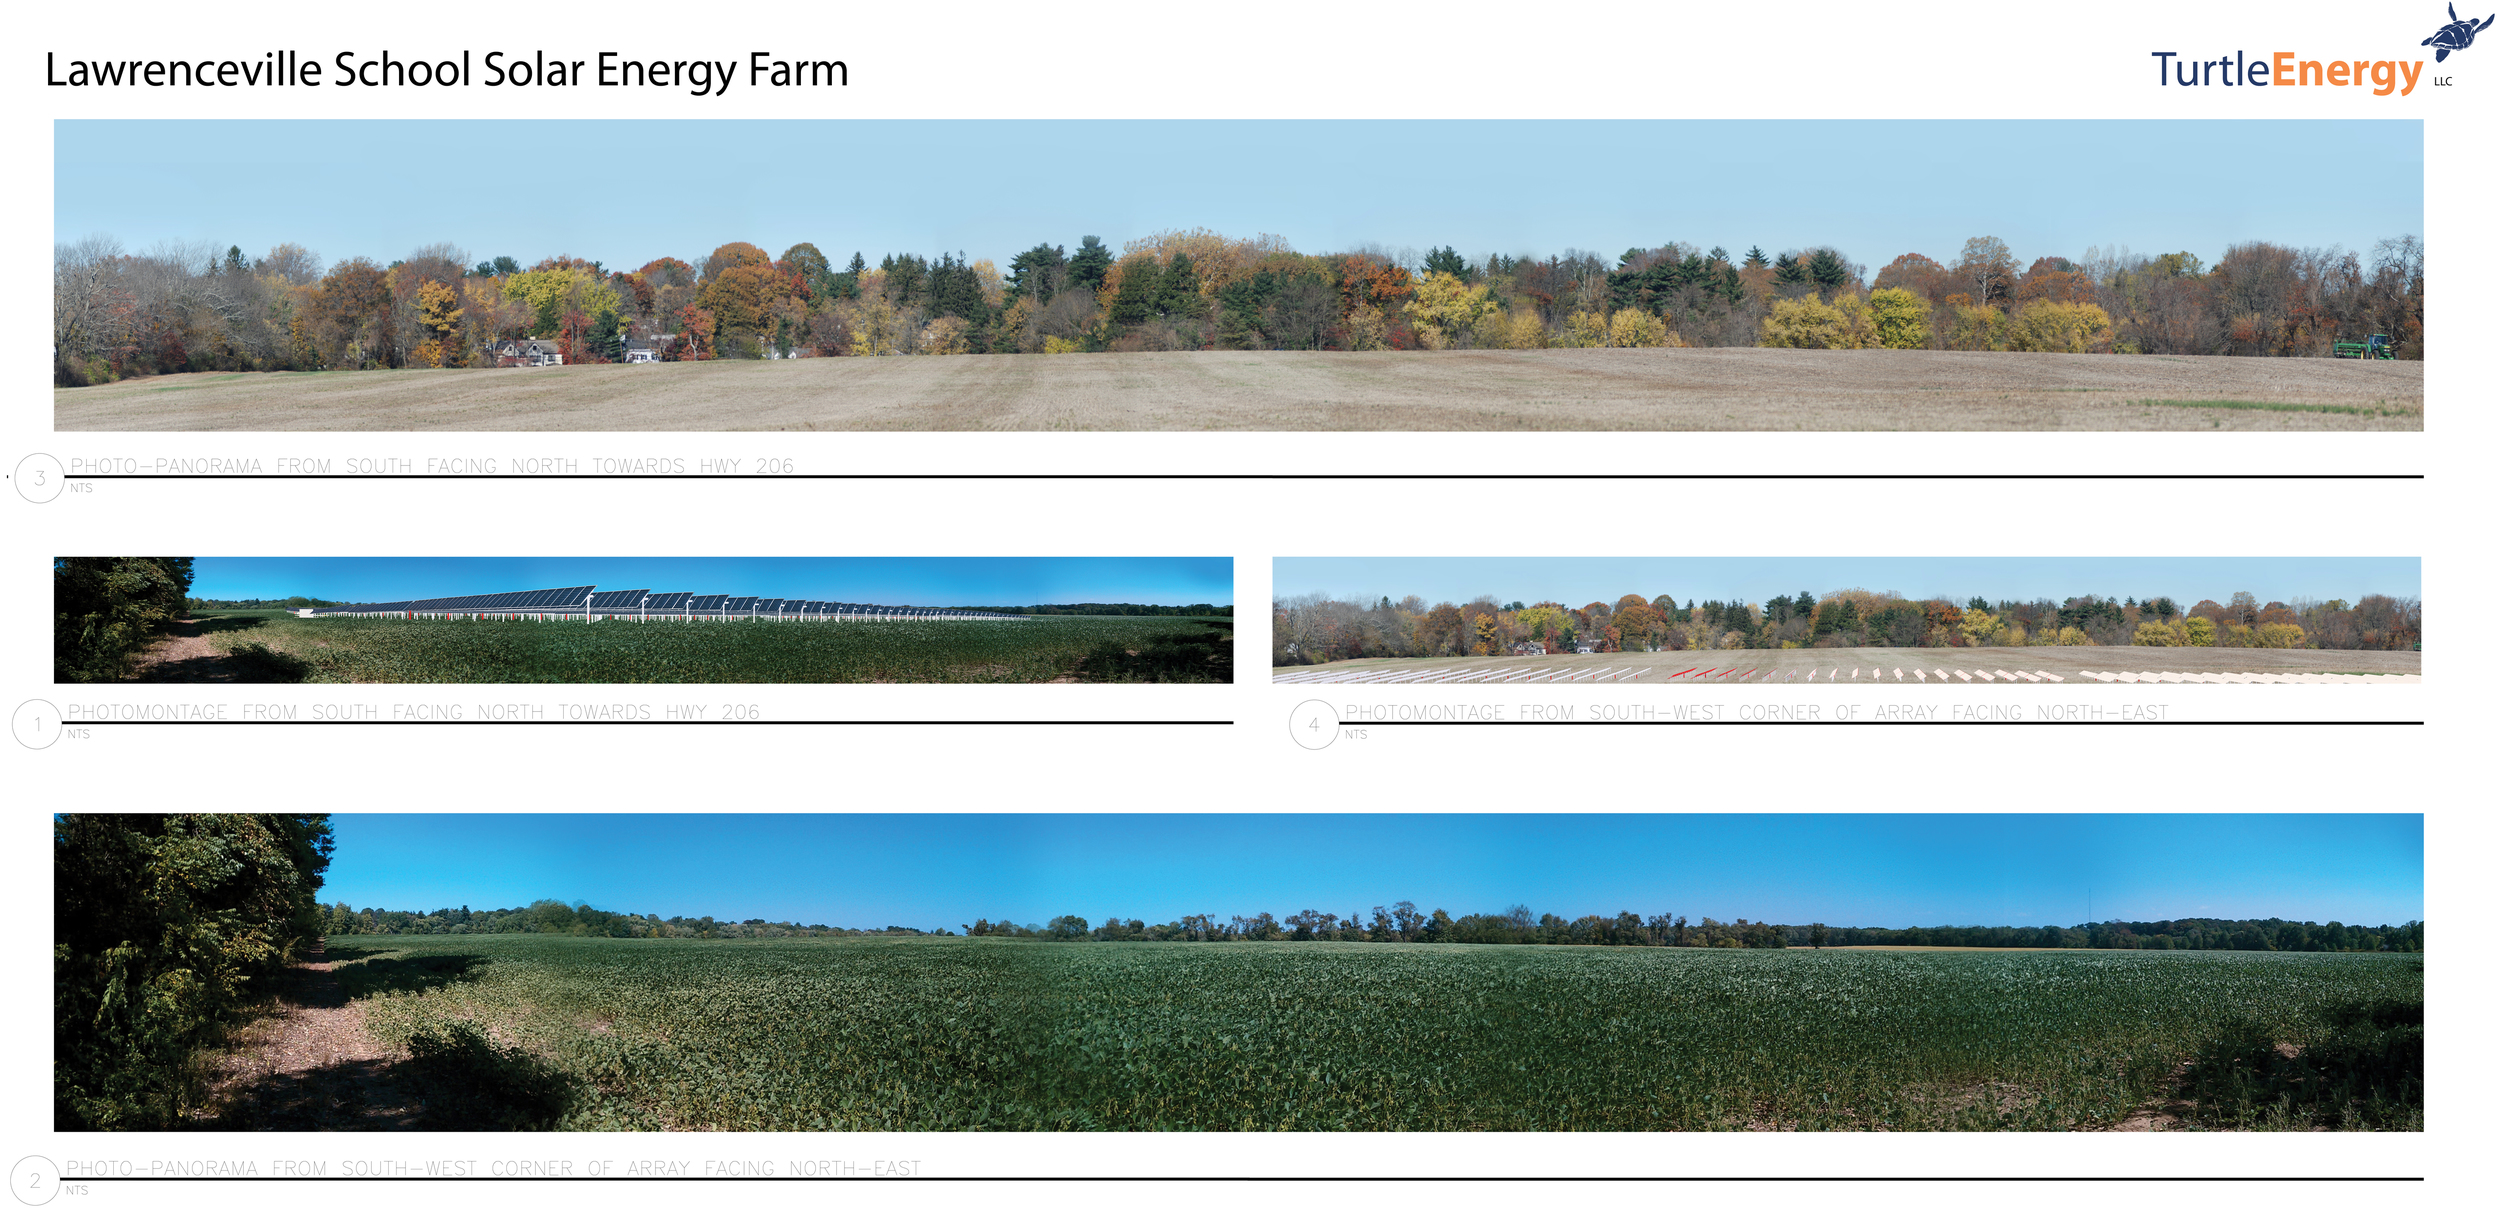
Zoning Illustration 2: Photomontage of proposal onto existing site panoramas allowed the zoning committee to understand the impact of the project on adjoining owners and passers-by alike.
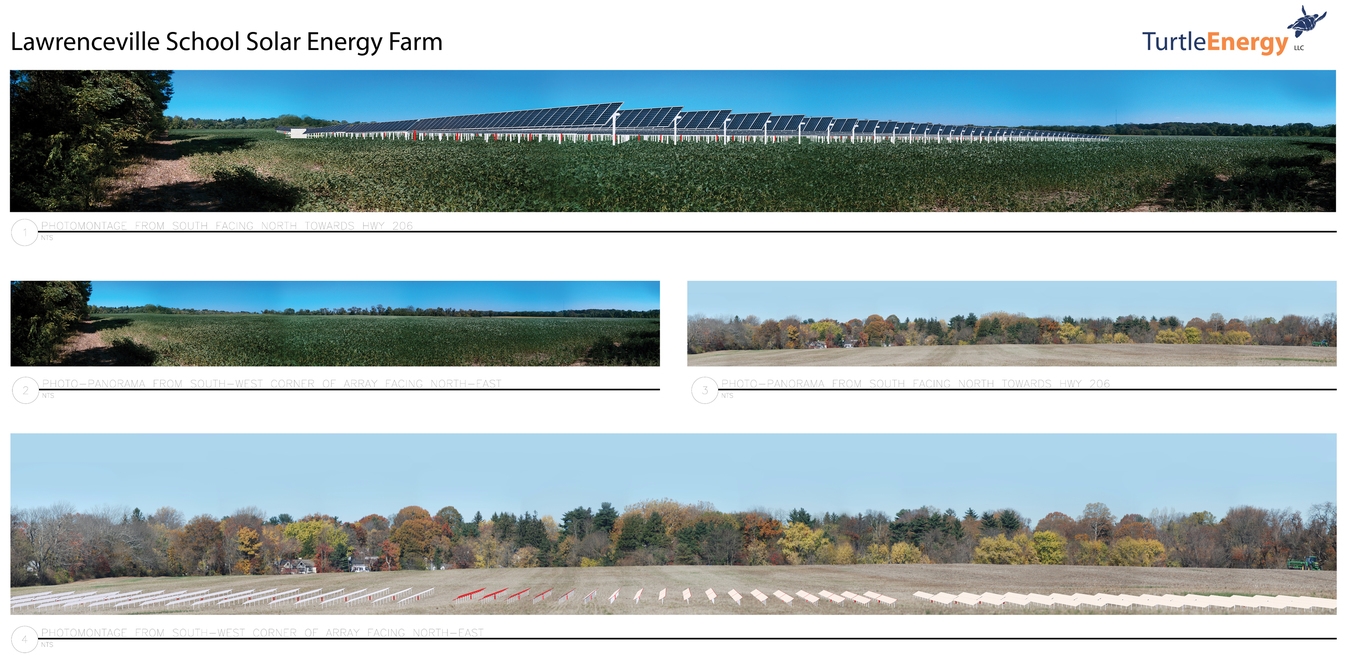
Zoning Illustration 3: Photomontage of proposal onto existing site panoramas allowed the zoning committee to understand the impact of the project on adjoining owners and passers-by alike.
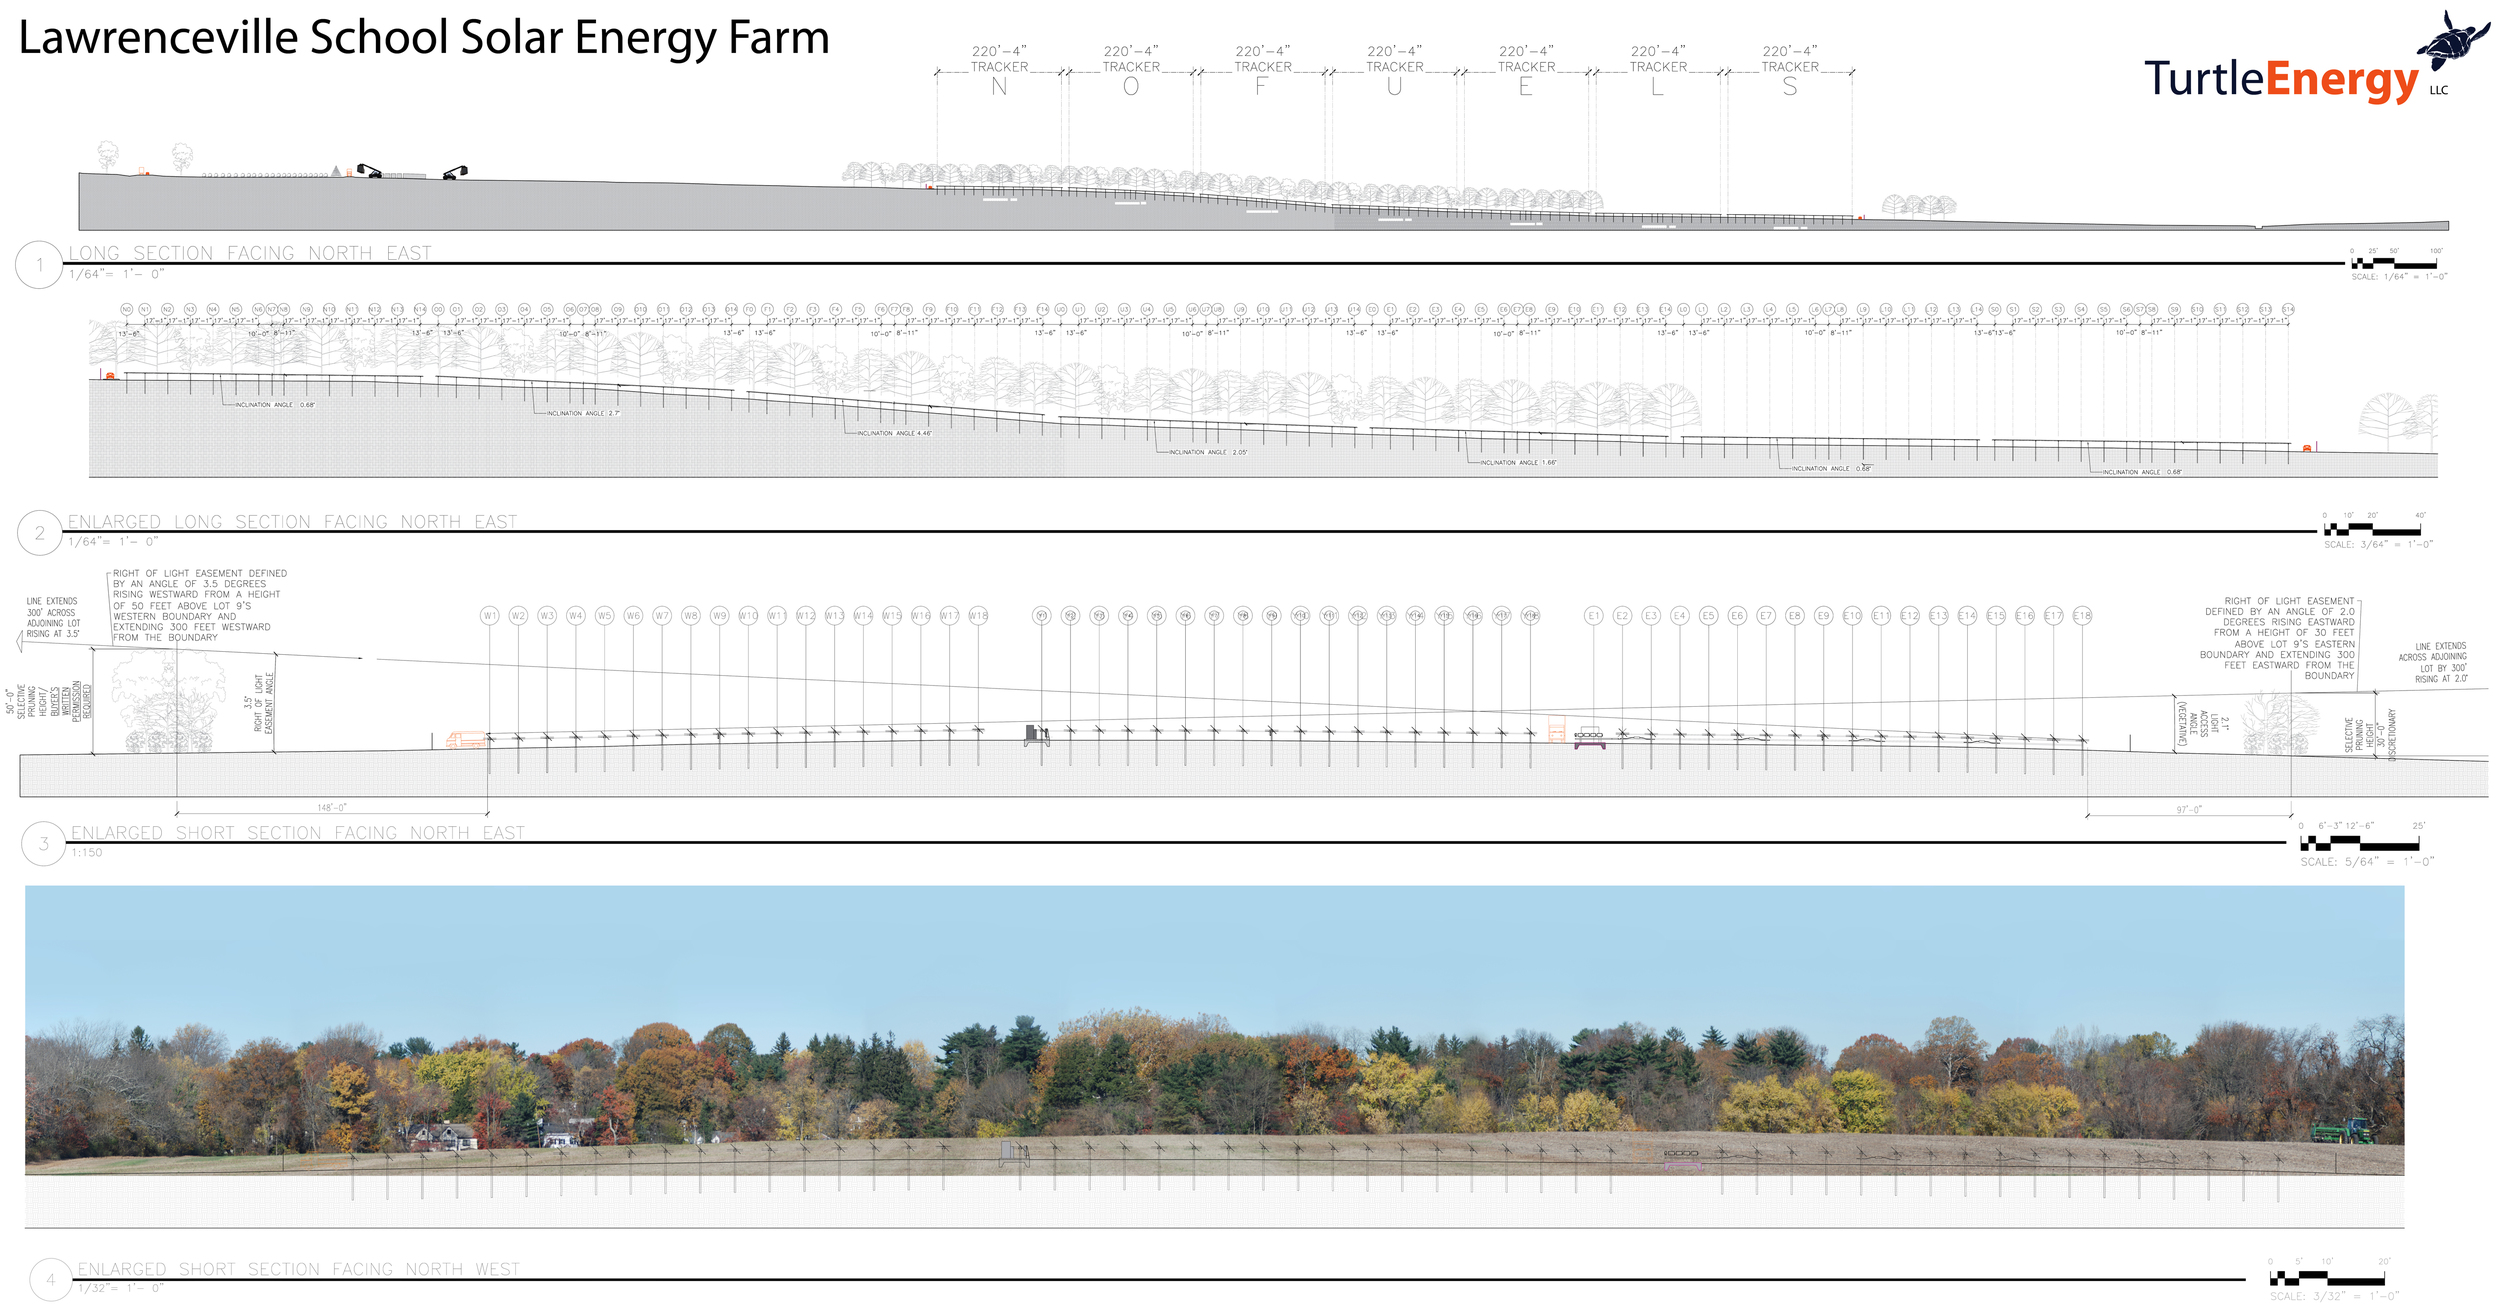
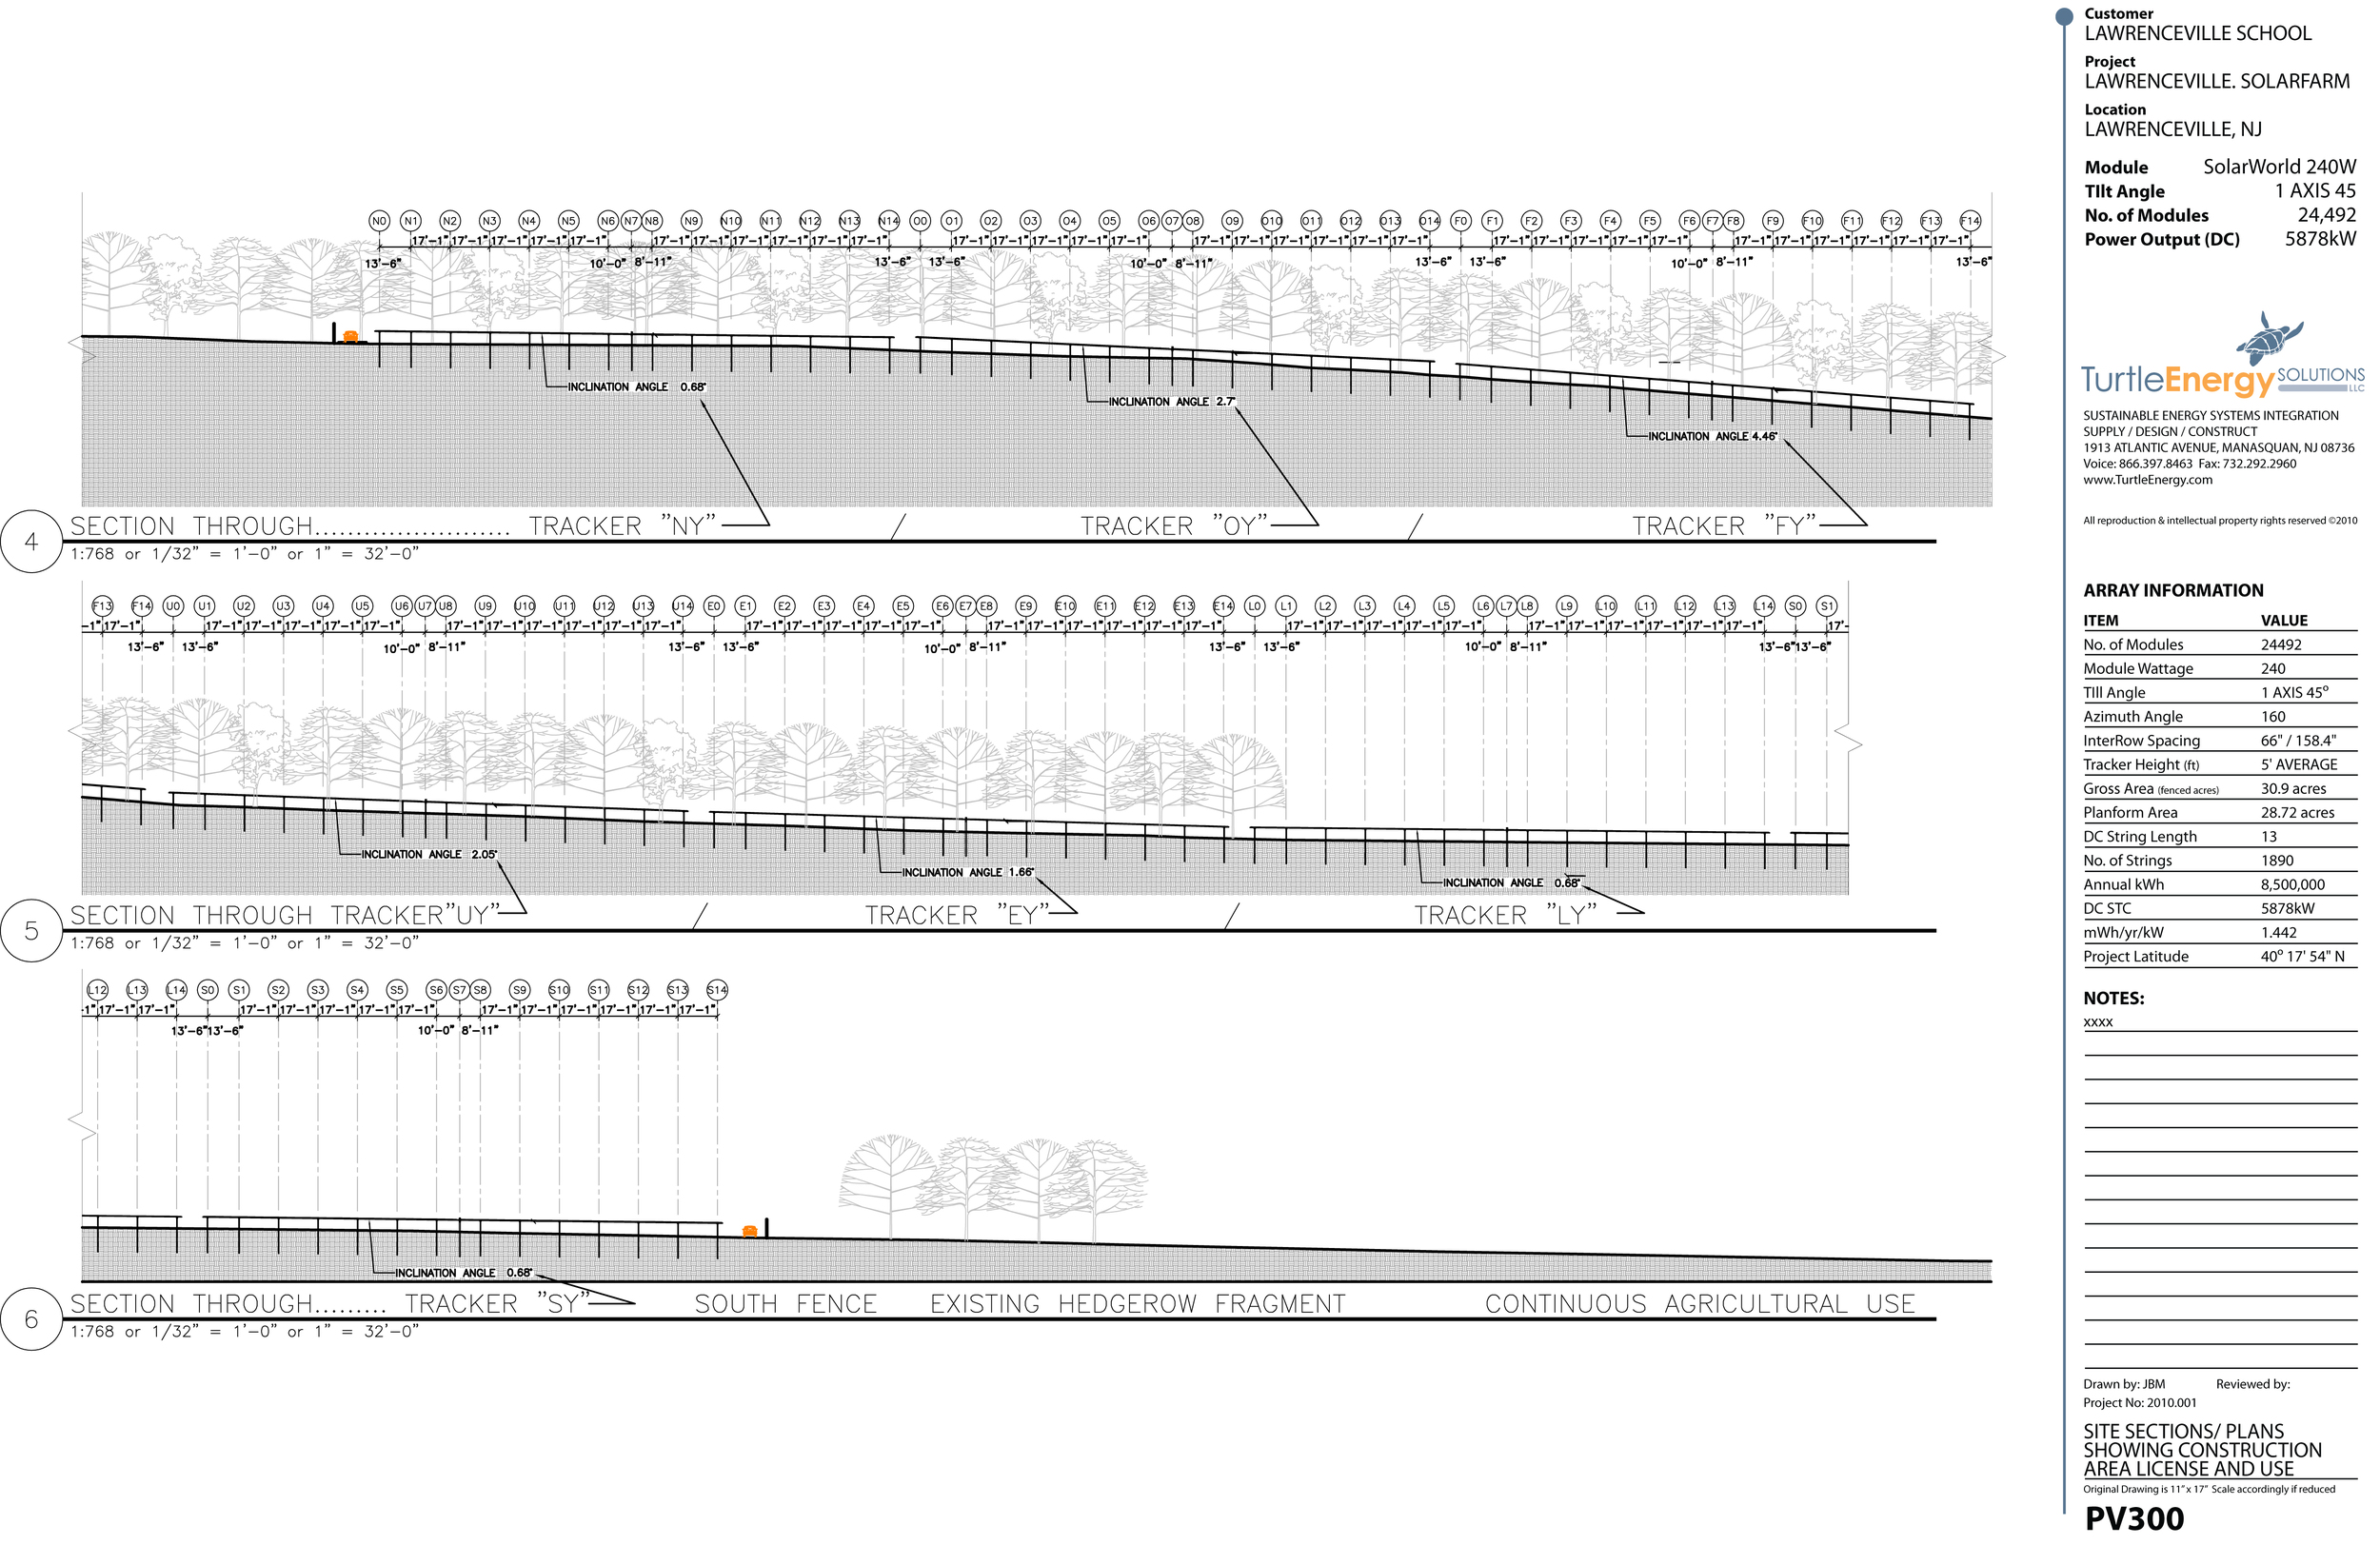
Zoning Illustration 4: Photomontage/ site sections of proposal onto existing site allowed the zoning committee to understand the impact of the project on adjoining owners and passers-by alike.
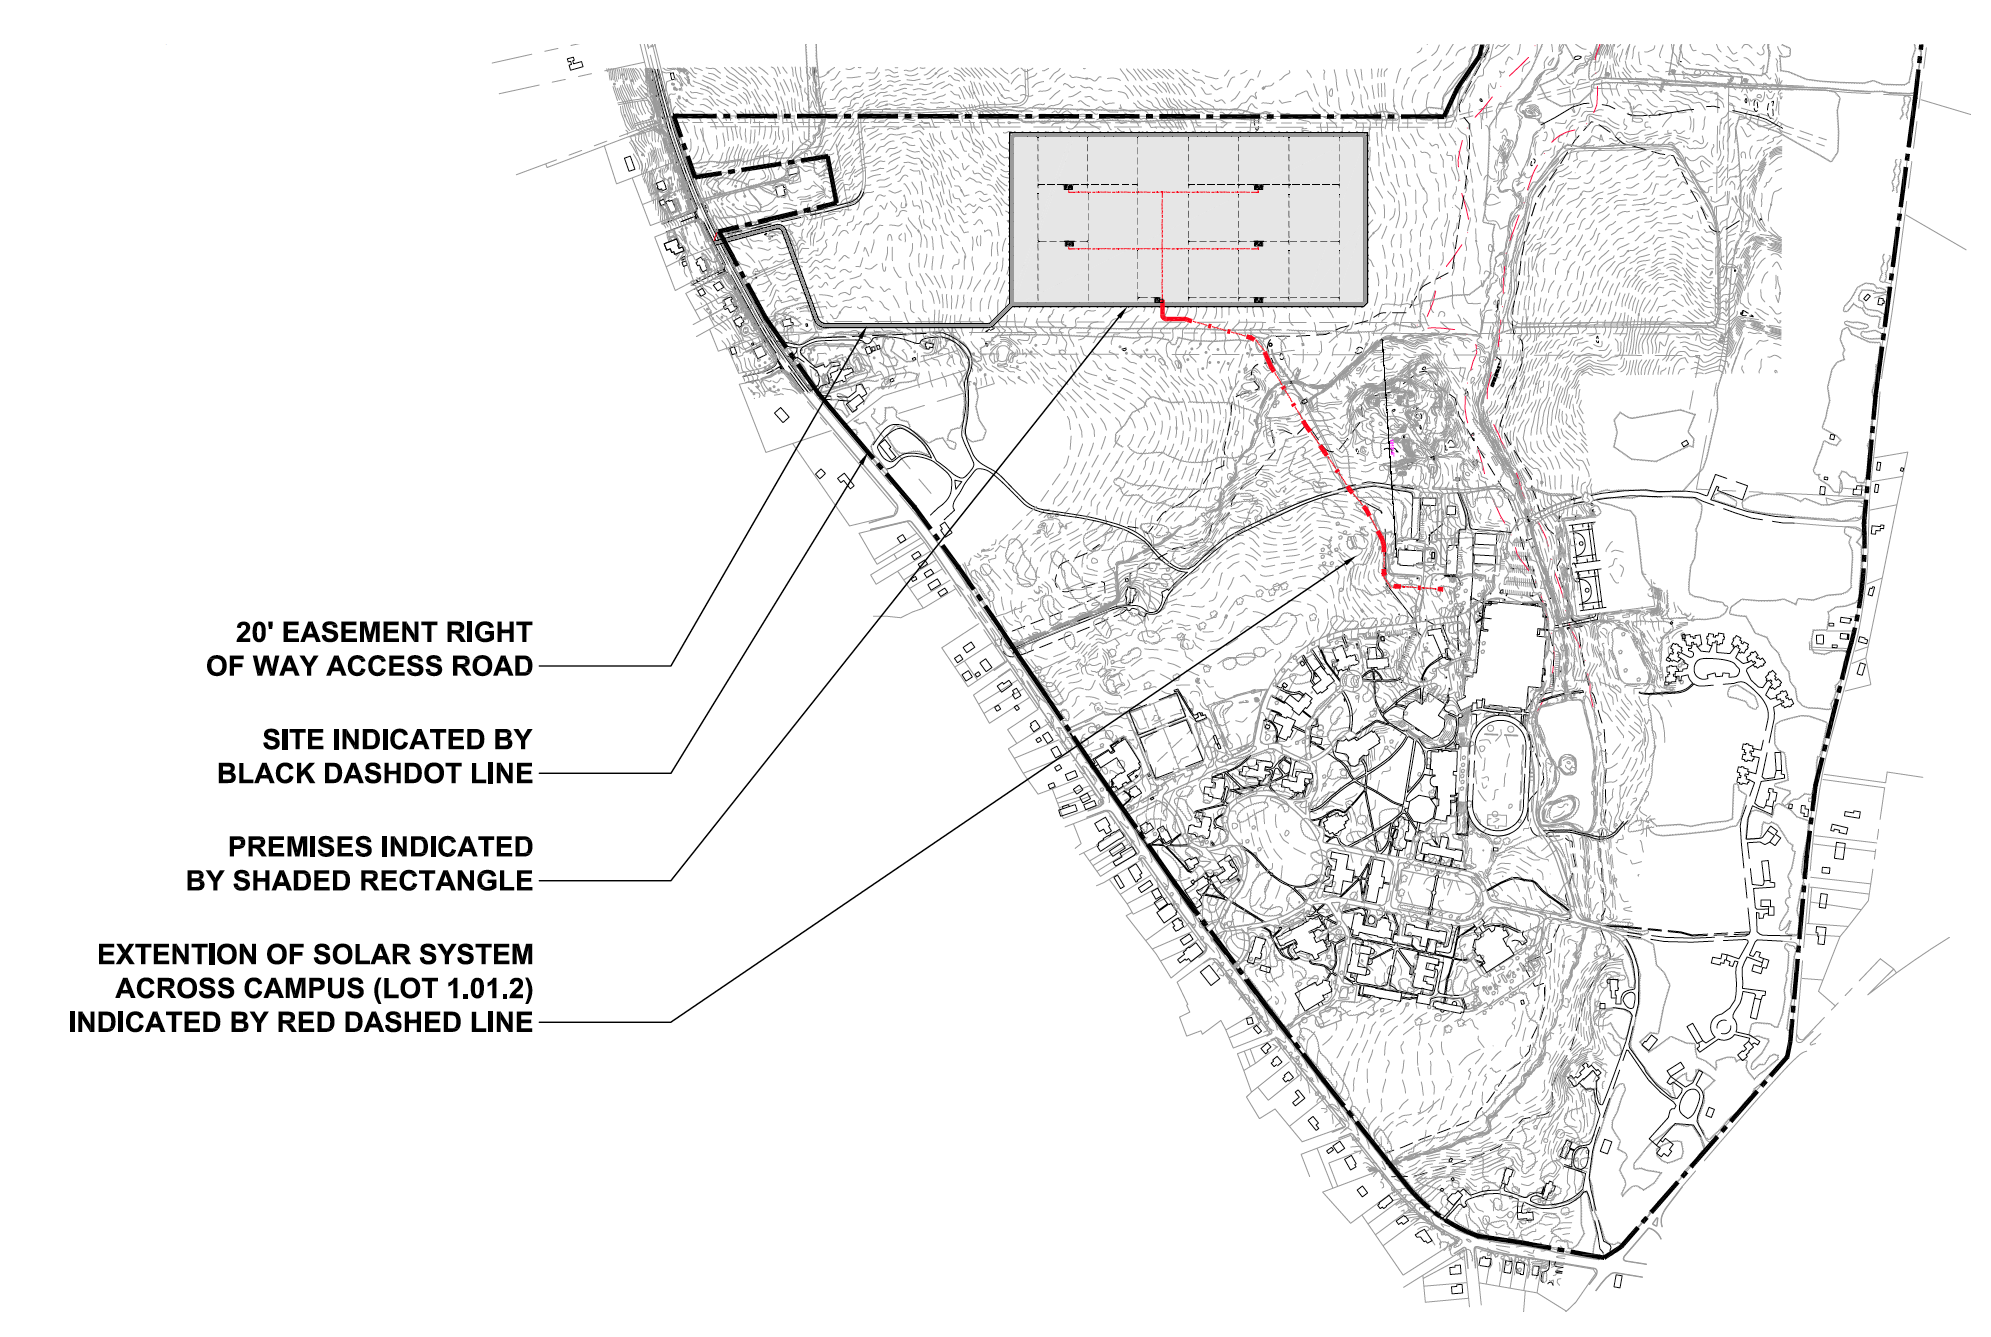
Figure 1: Site Plan showing electrical connection to campus electrical load center (red line) where a single PSE&G meter measures electrical consumption for the entire school.
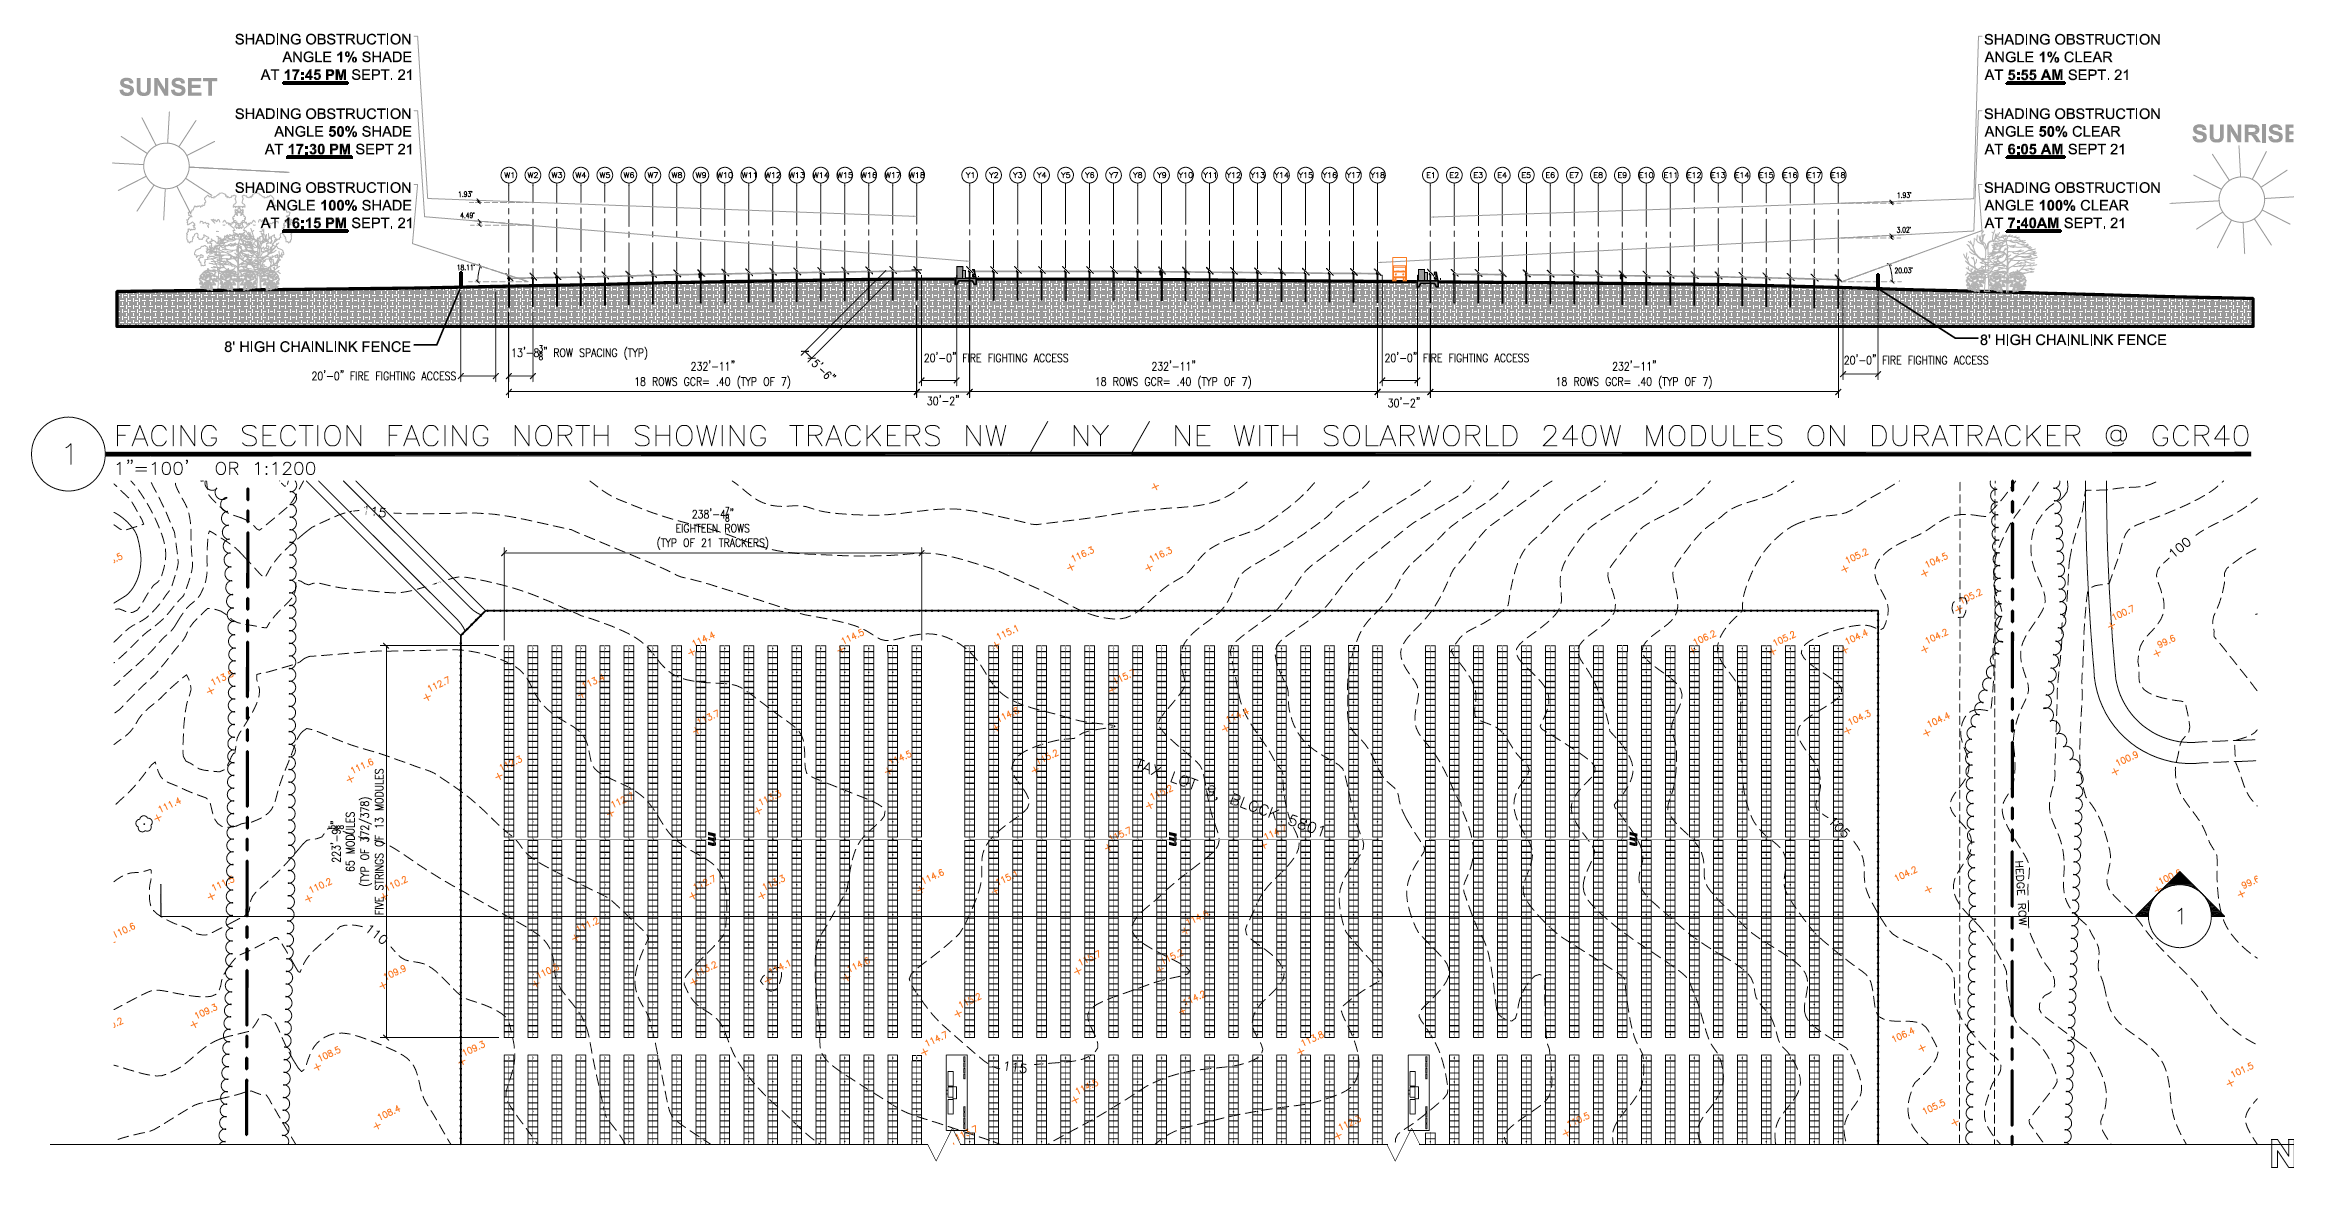
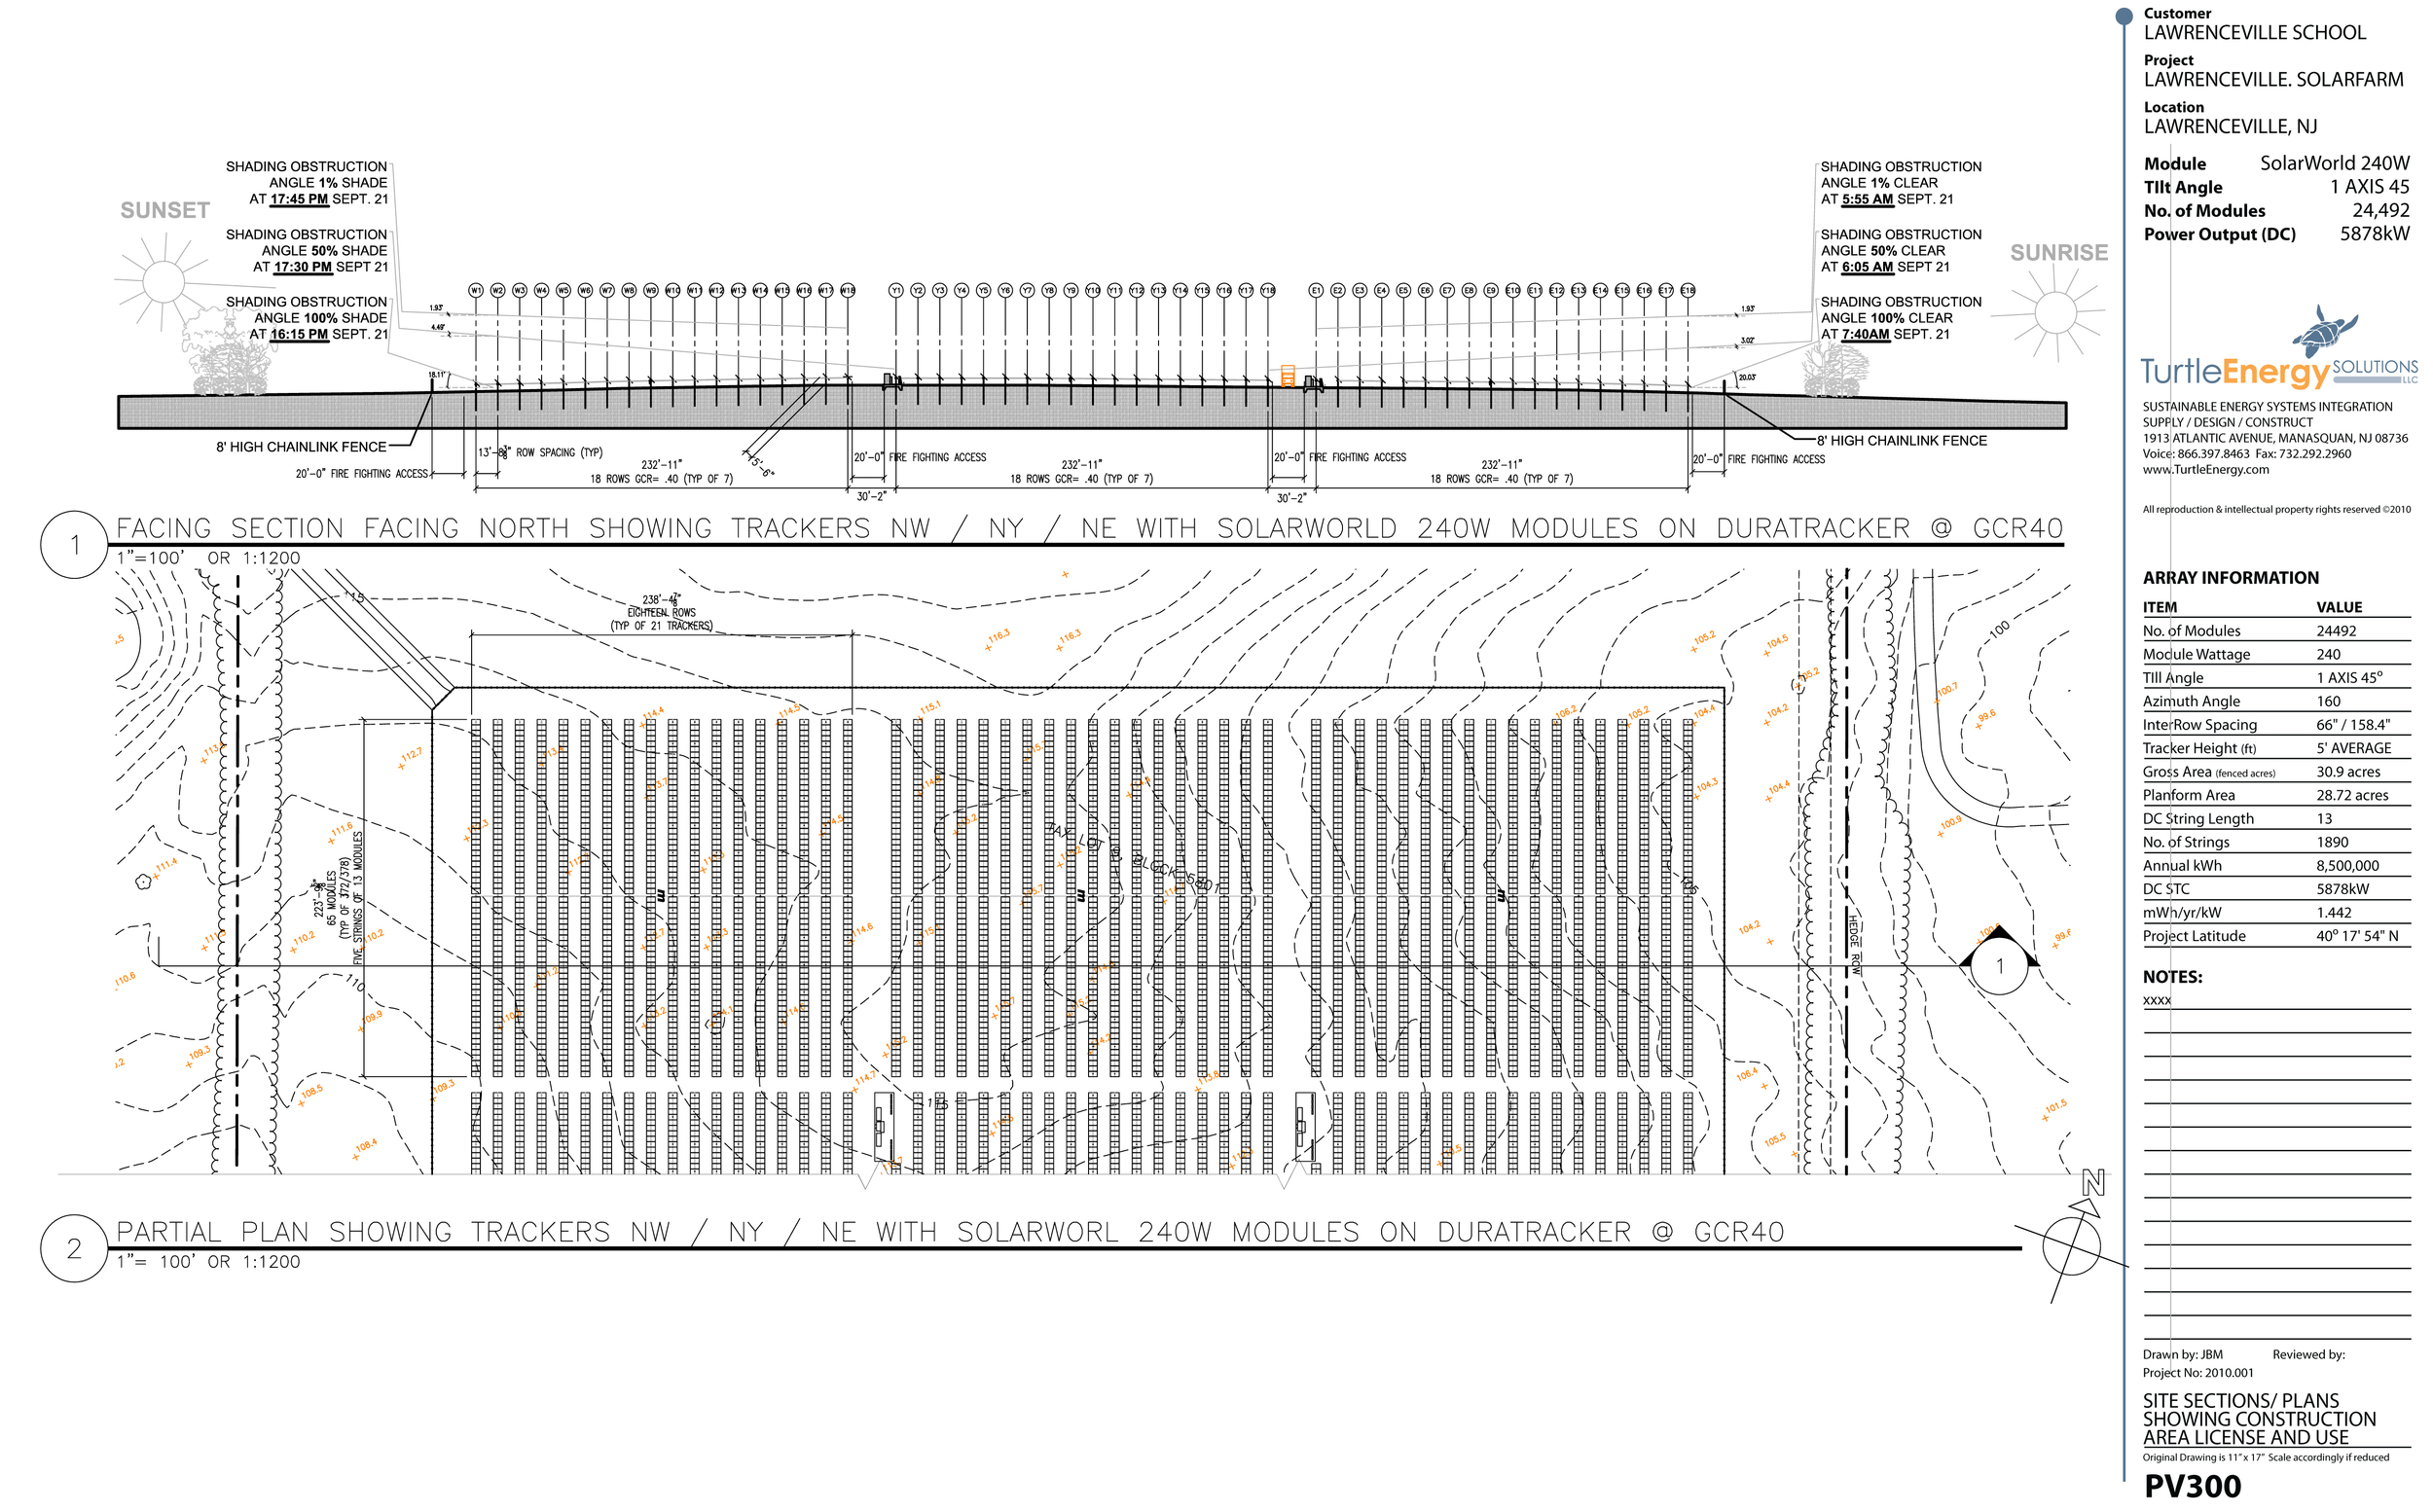
Figure 2: Rights of Light Section/ Plan recording the angles of obstruction at the inception of the 20 year purchase agreement.
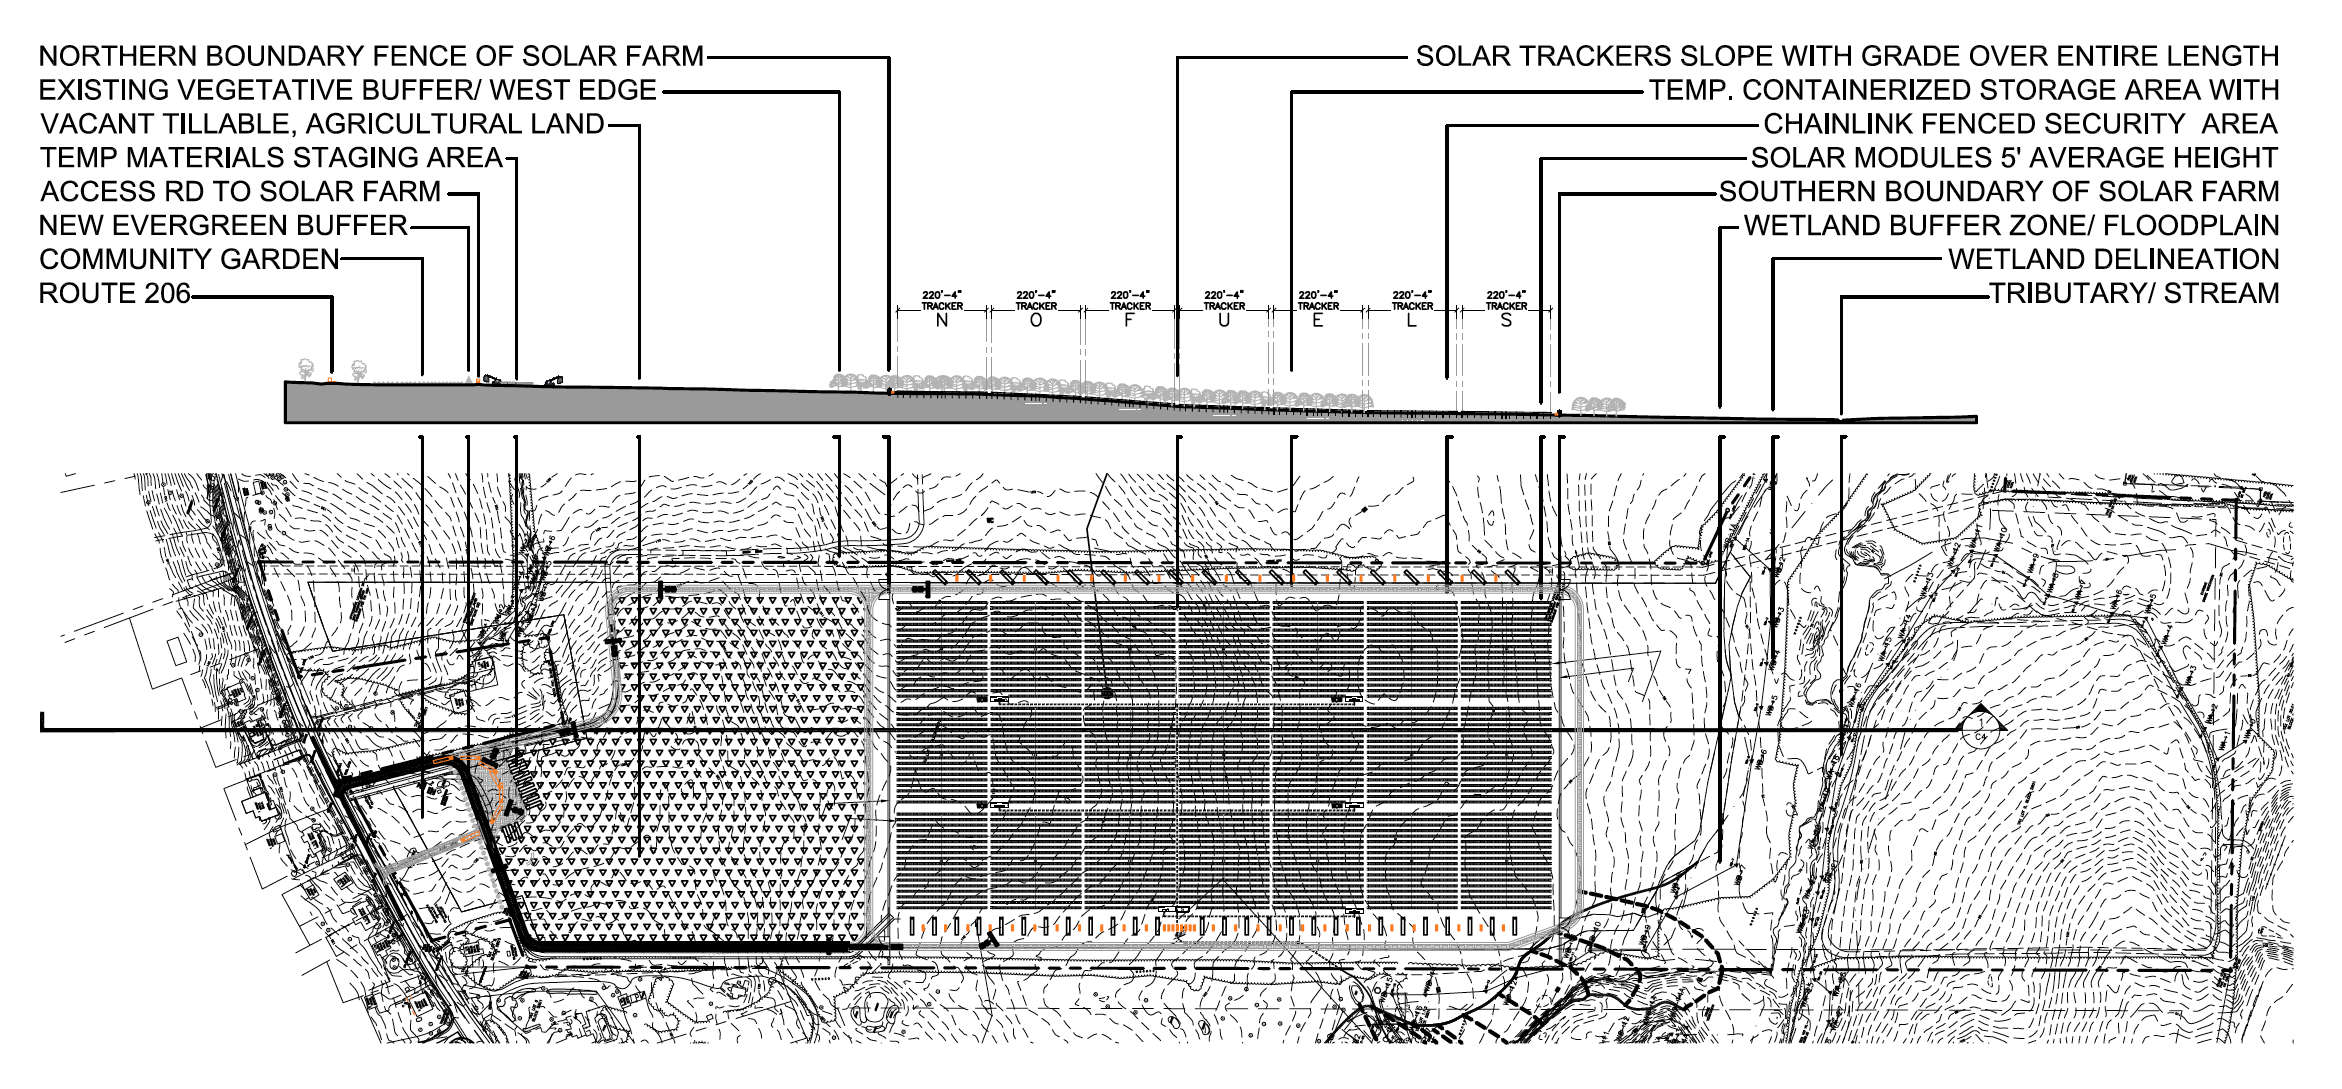
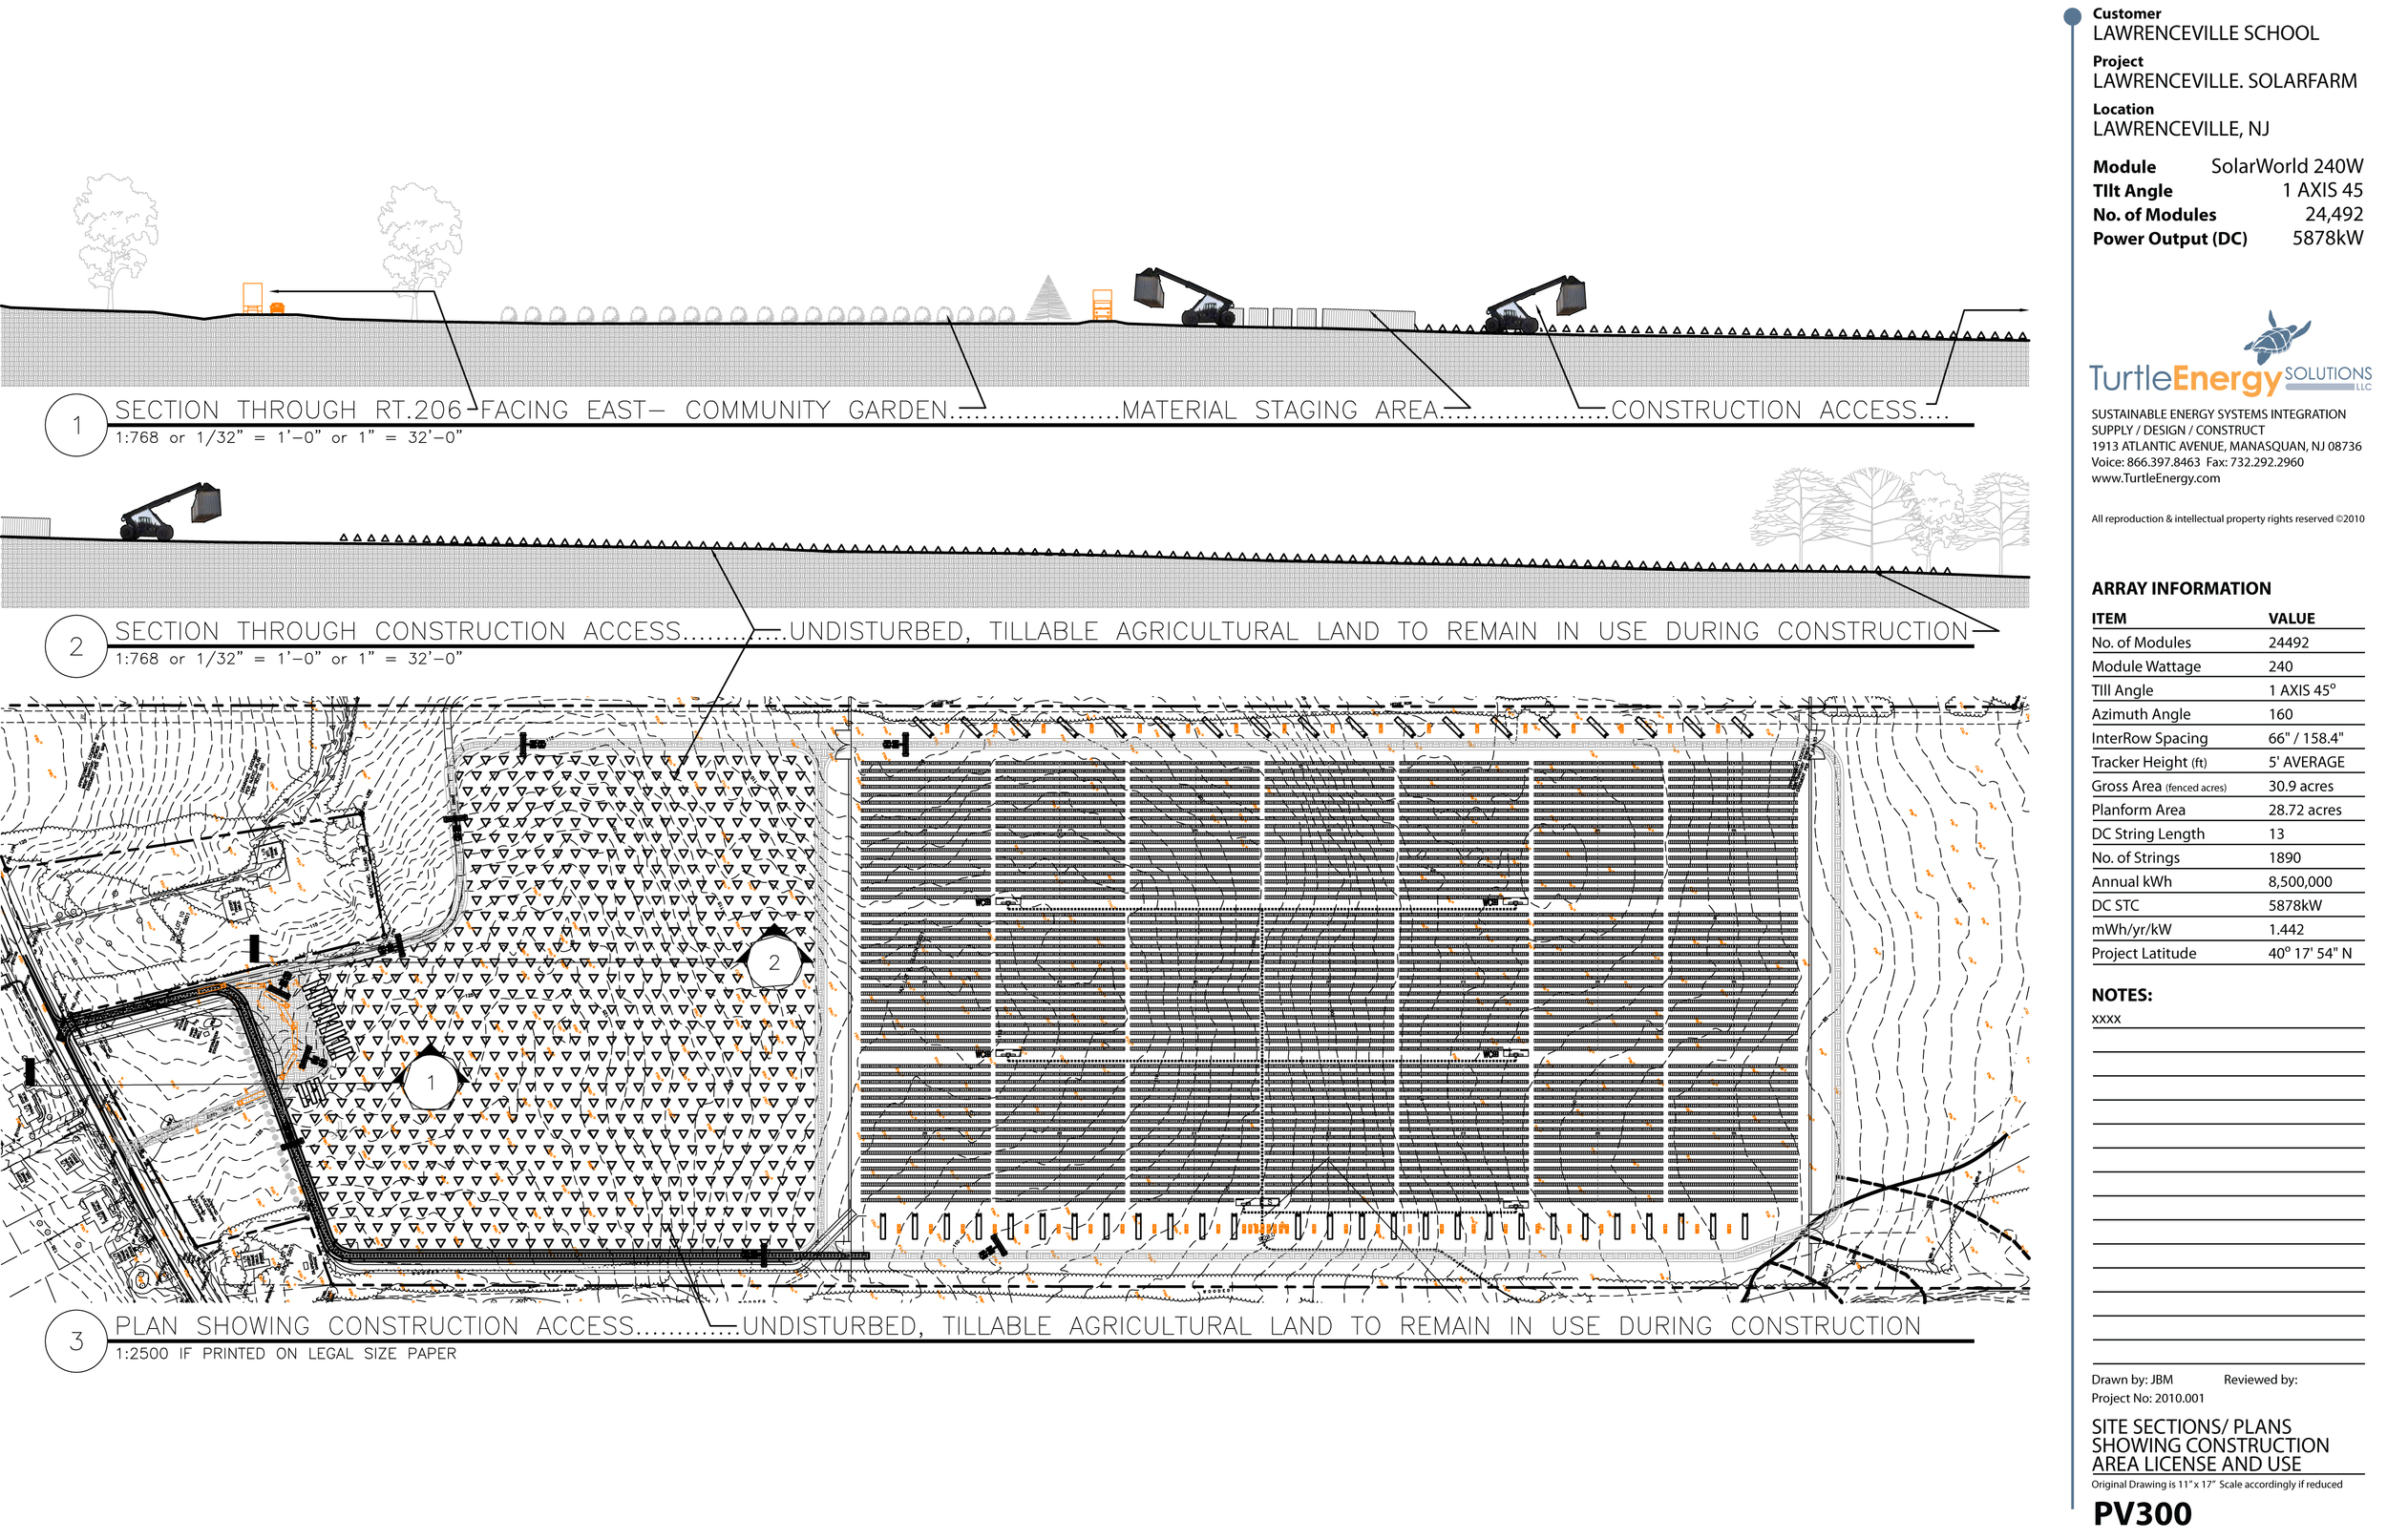
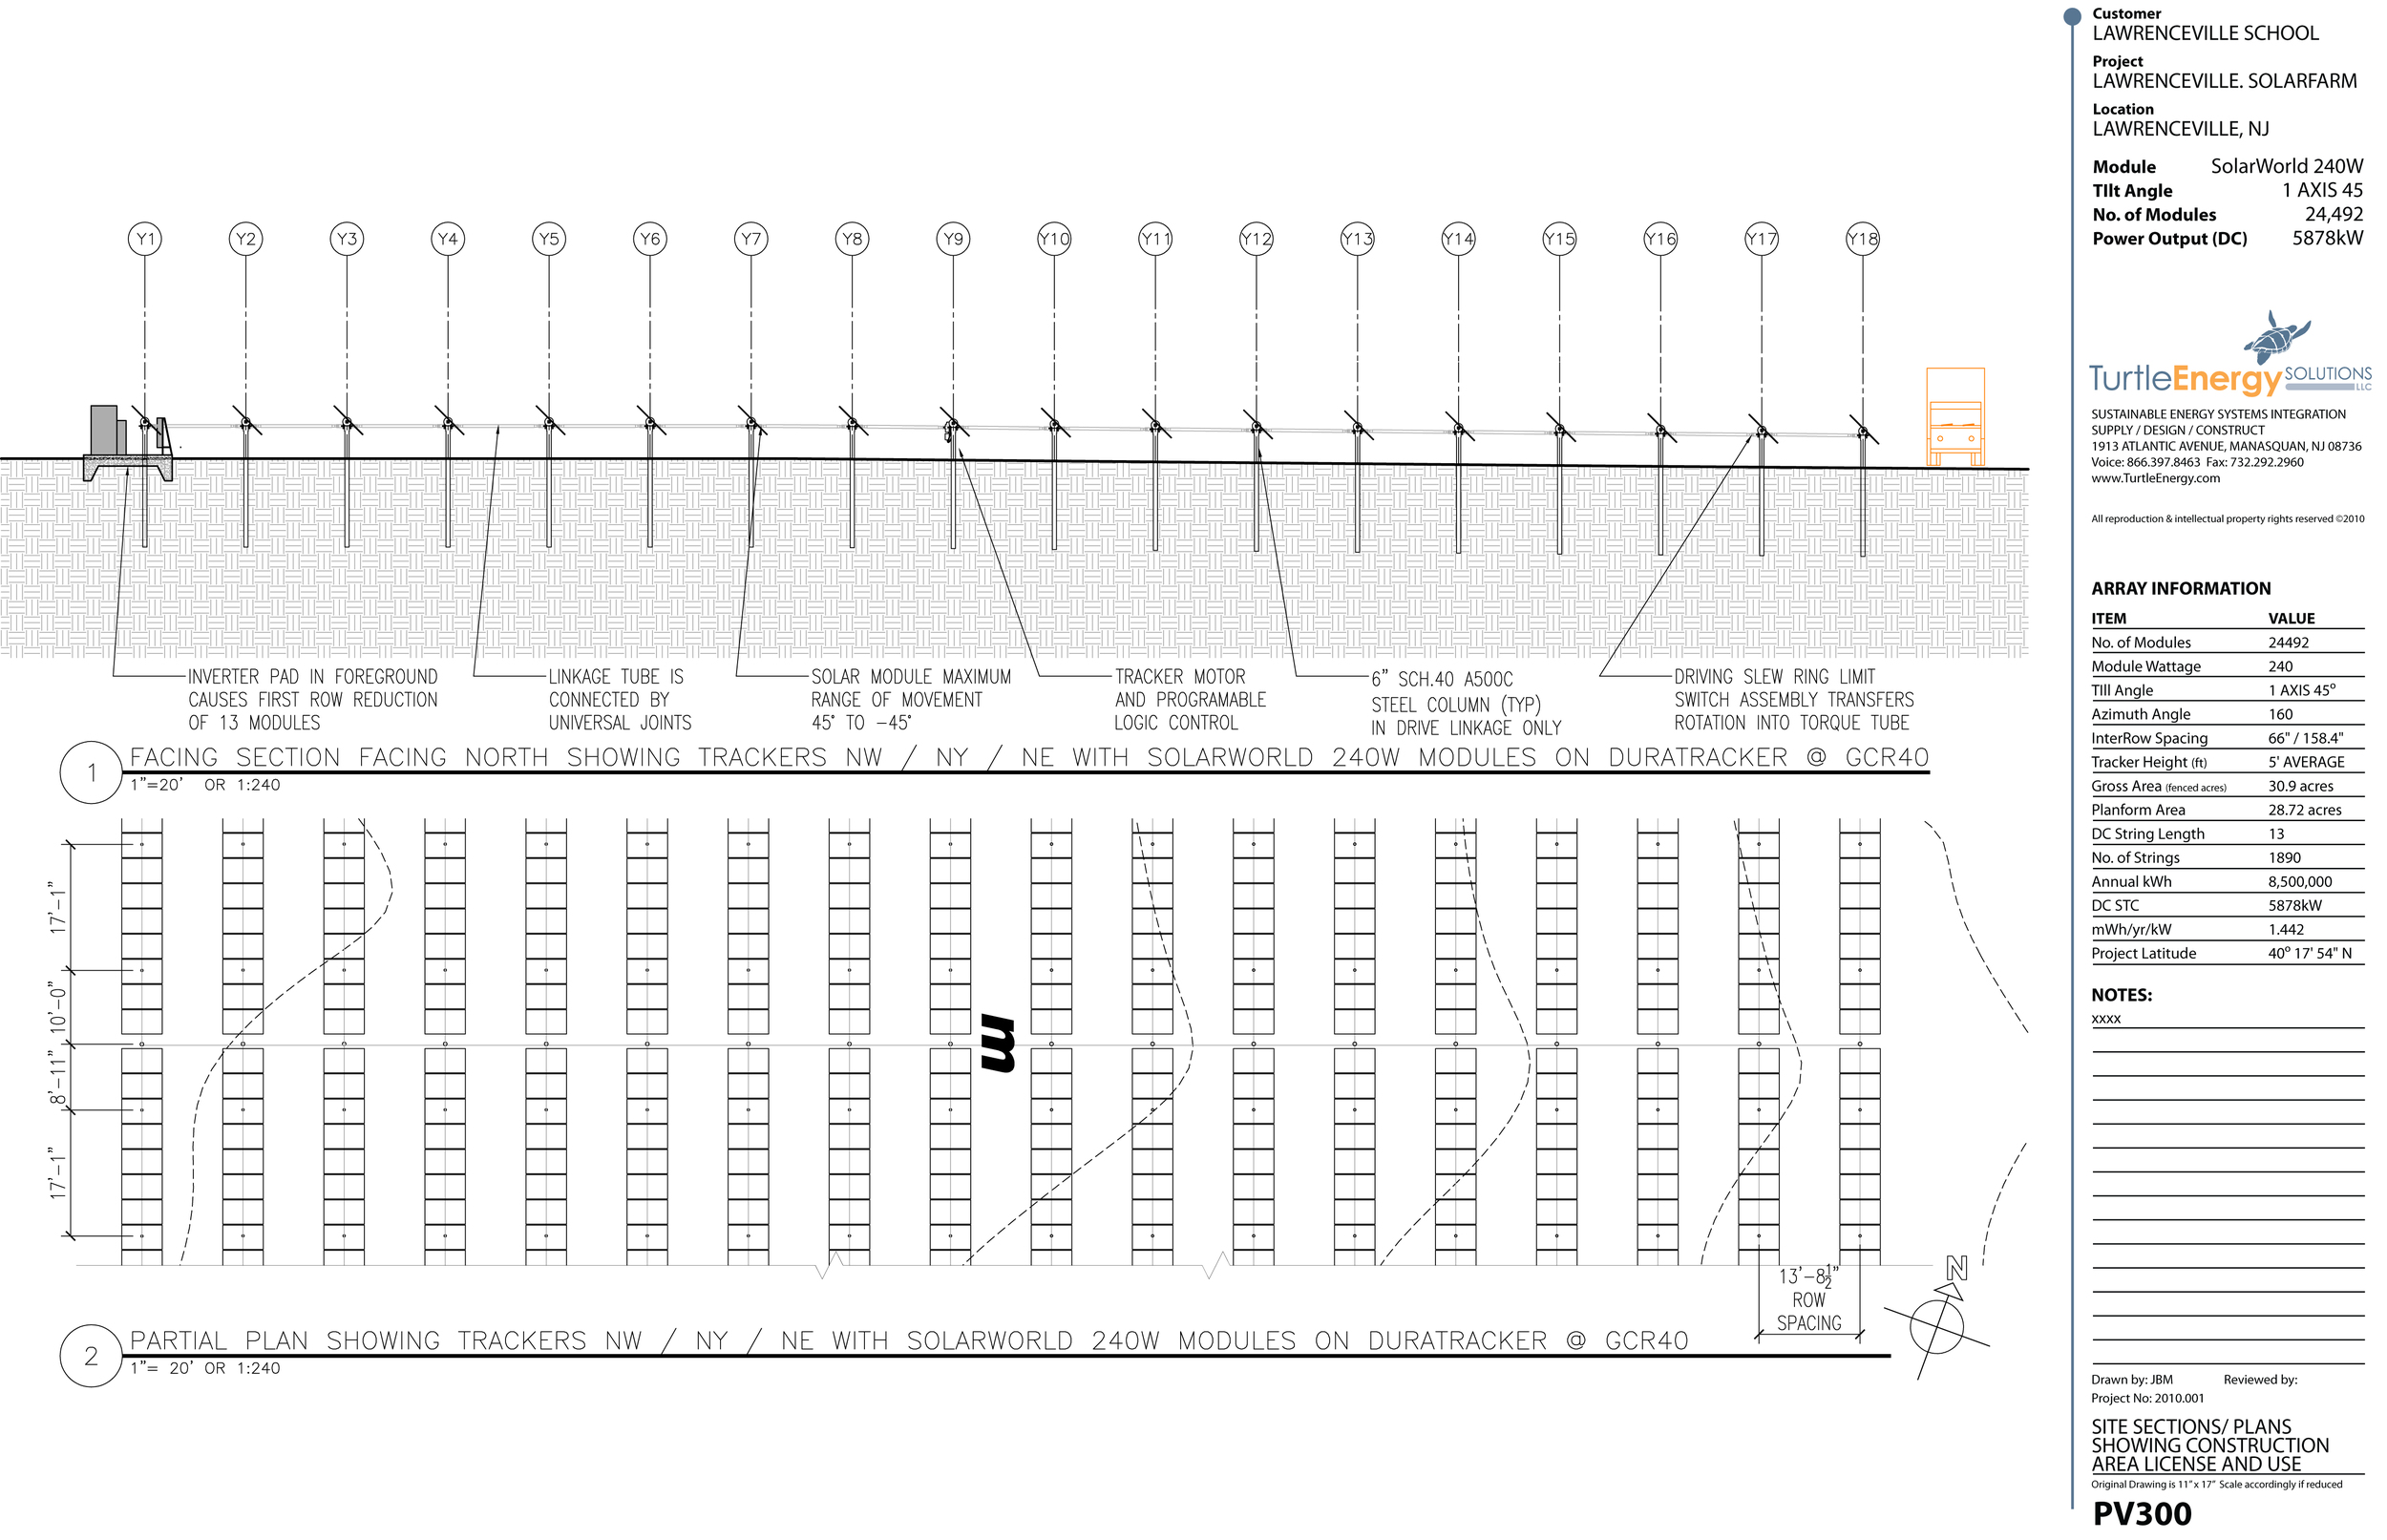
Figure 3: Site Section/ Plan showing construction area license and use.
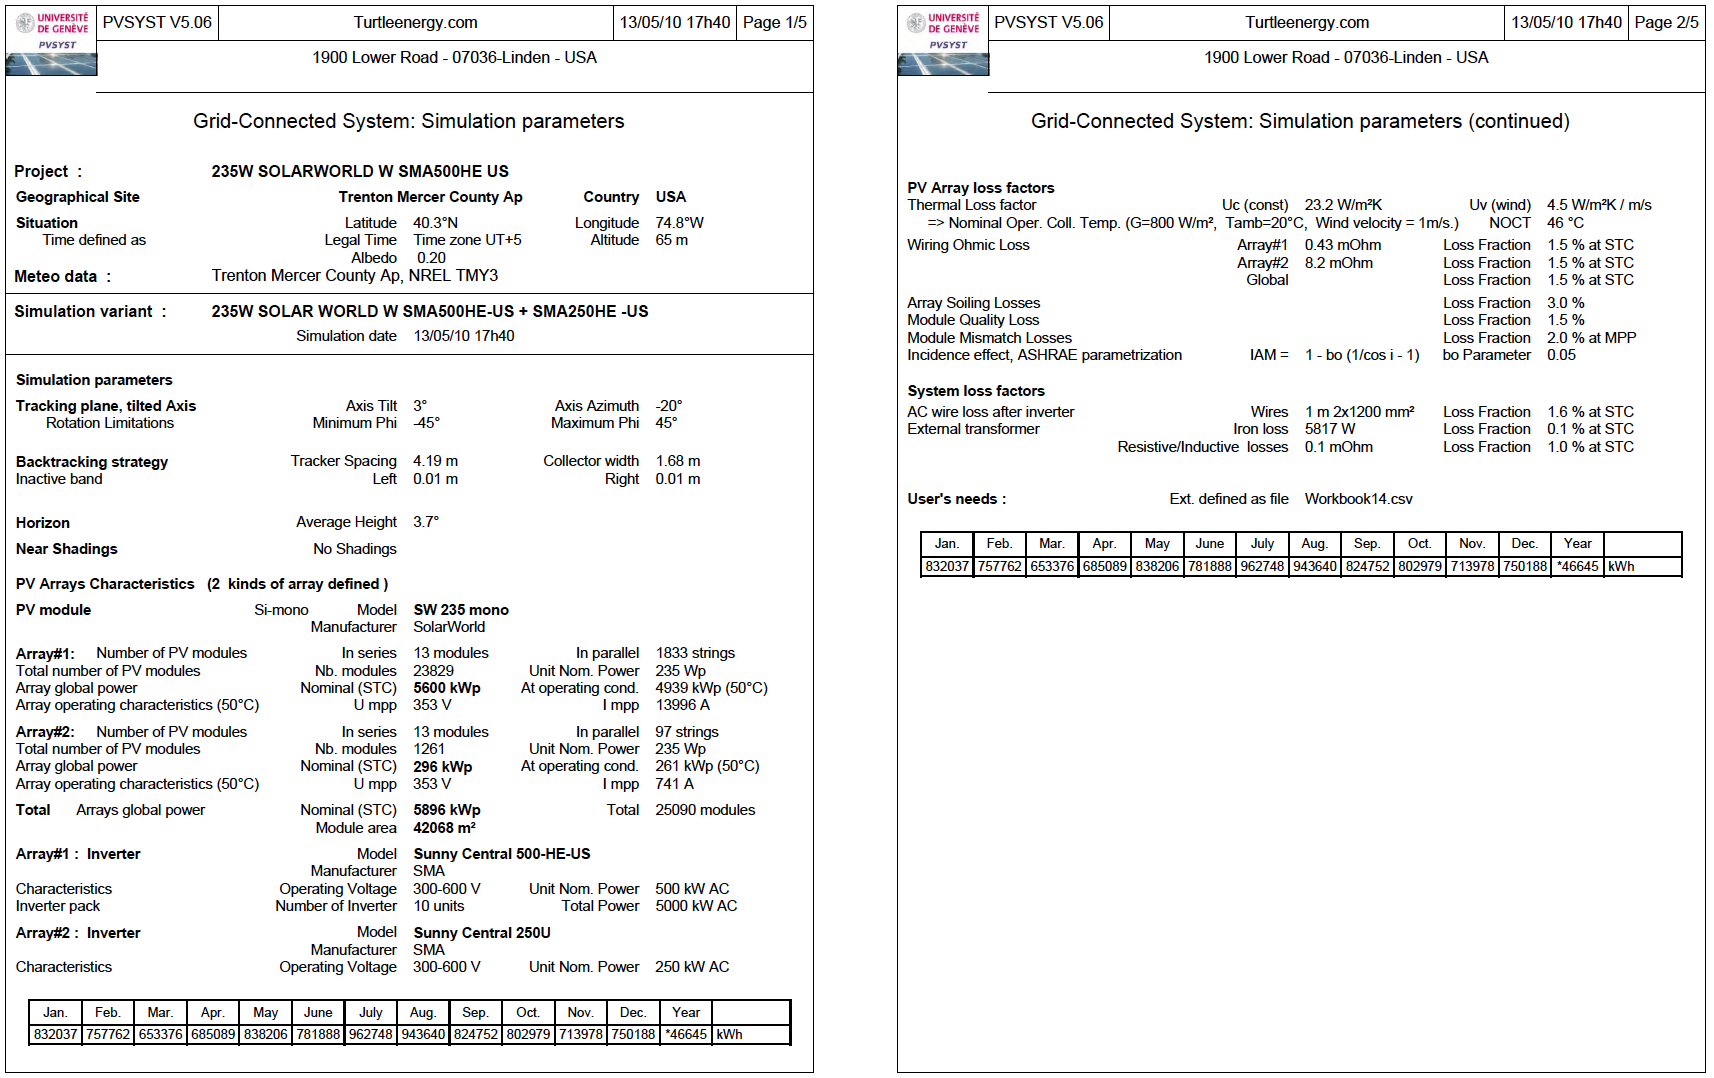
Table 1: Output from Energy Estimation Software PV Syst, recognized by lenders as an accurate industry tool.
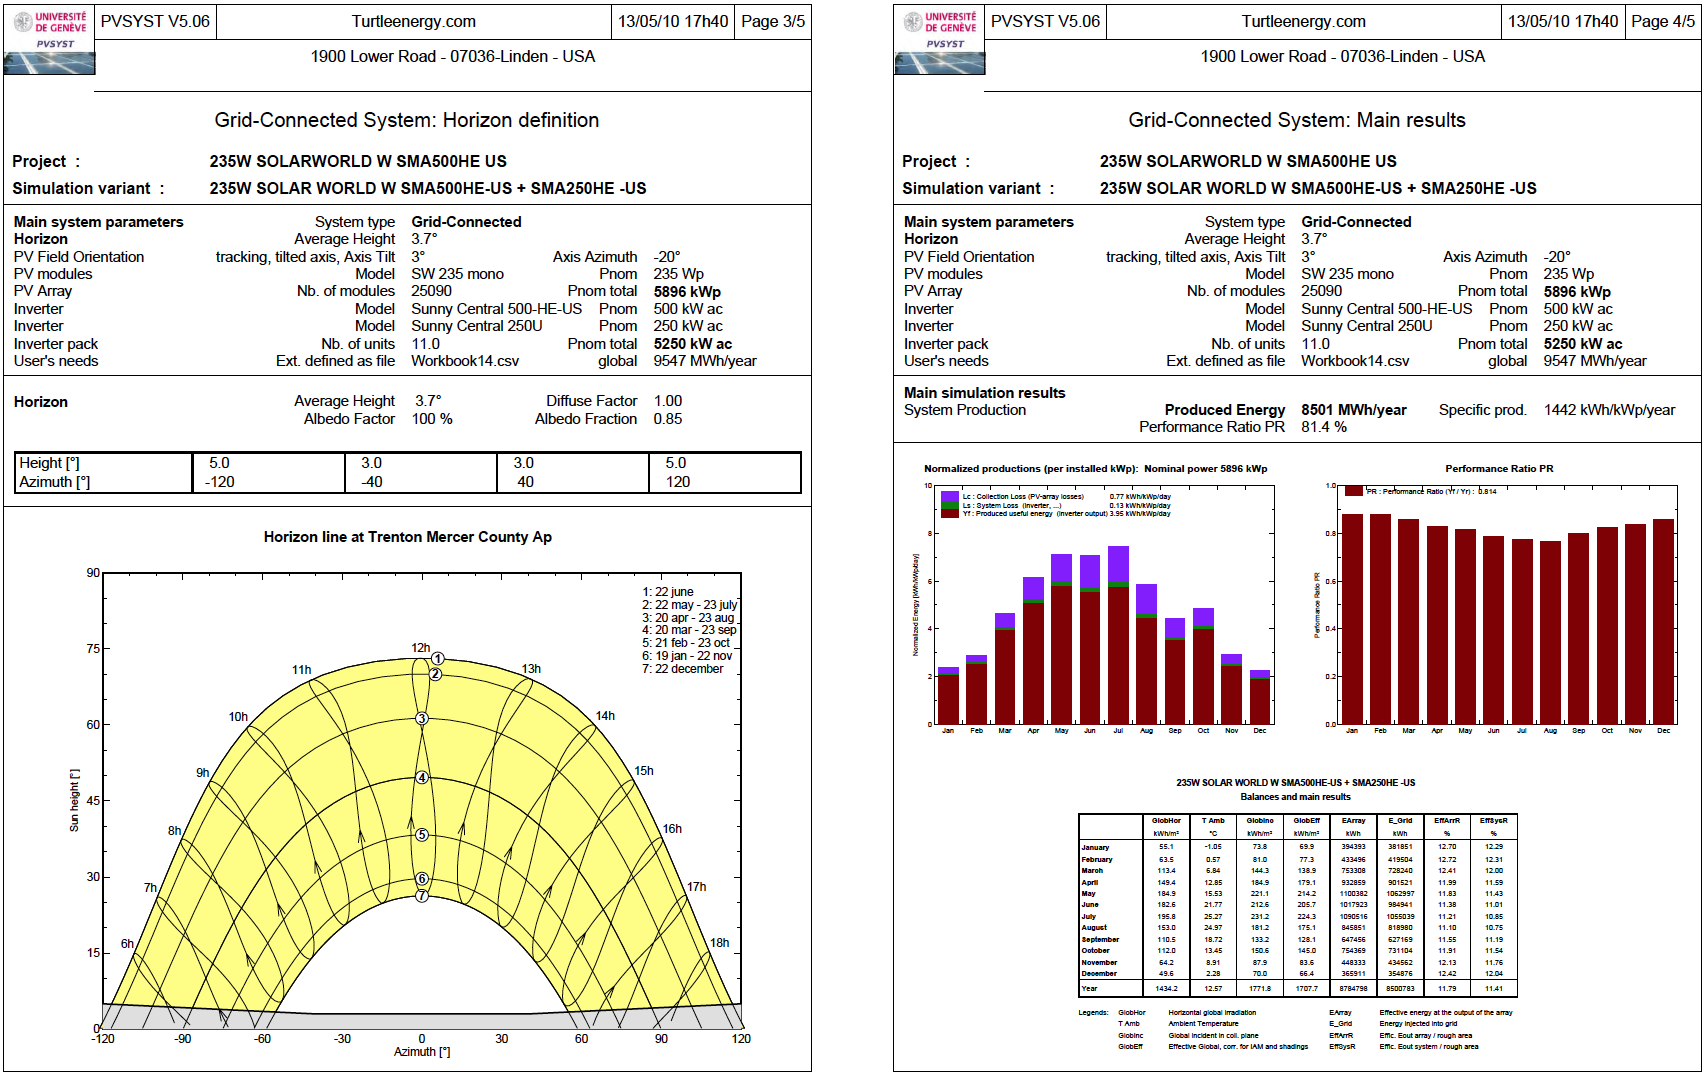
Table 1: Output from Energy Estimation Software PV Syst, recognized by lenders as an accurate industry tool.
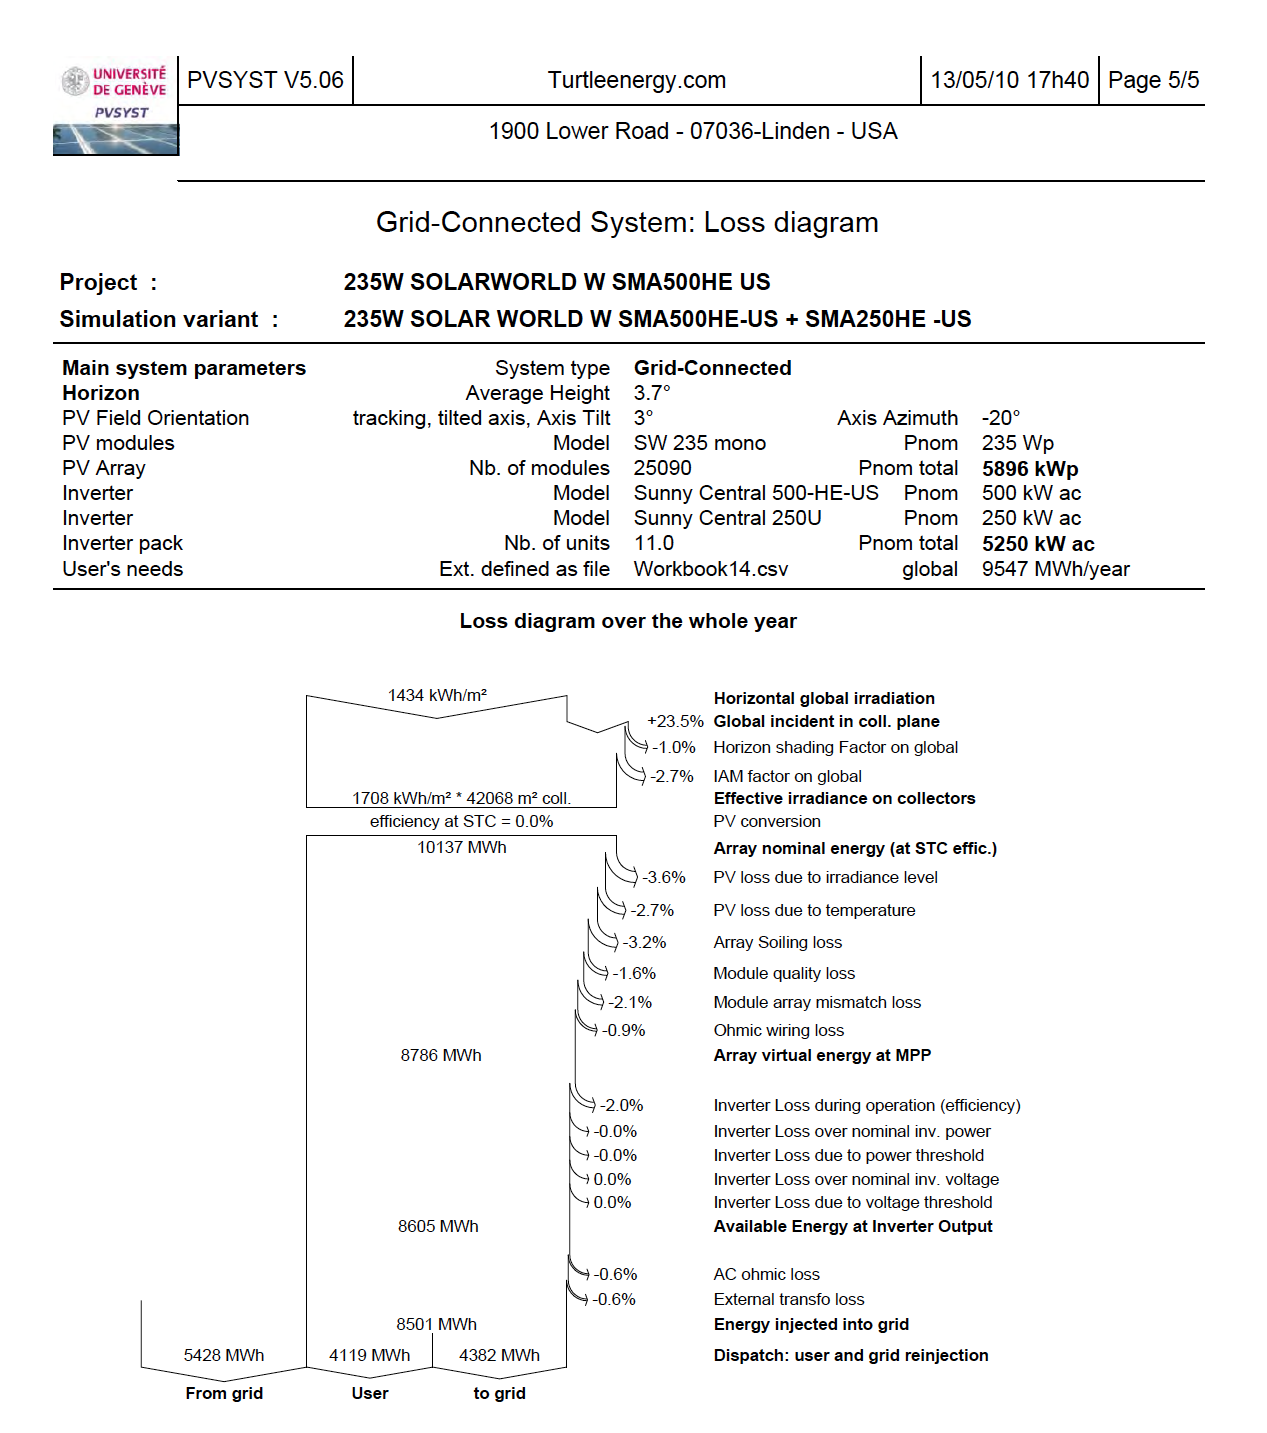
Table 3: Output from Energy Estimation Software PV Syst, recognized by lenders as an accurate industry tool.
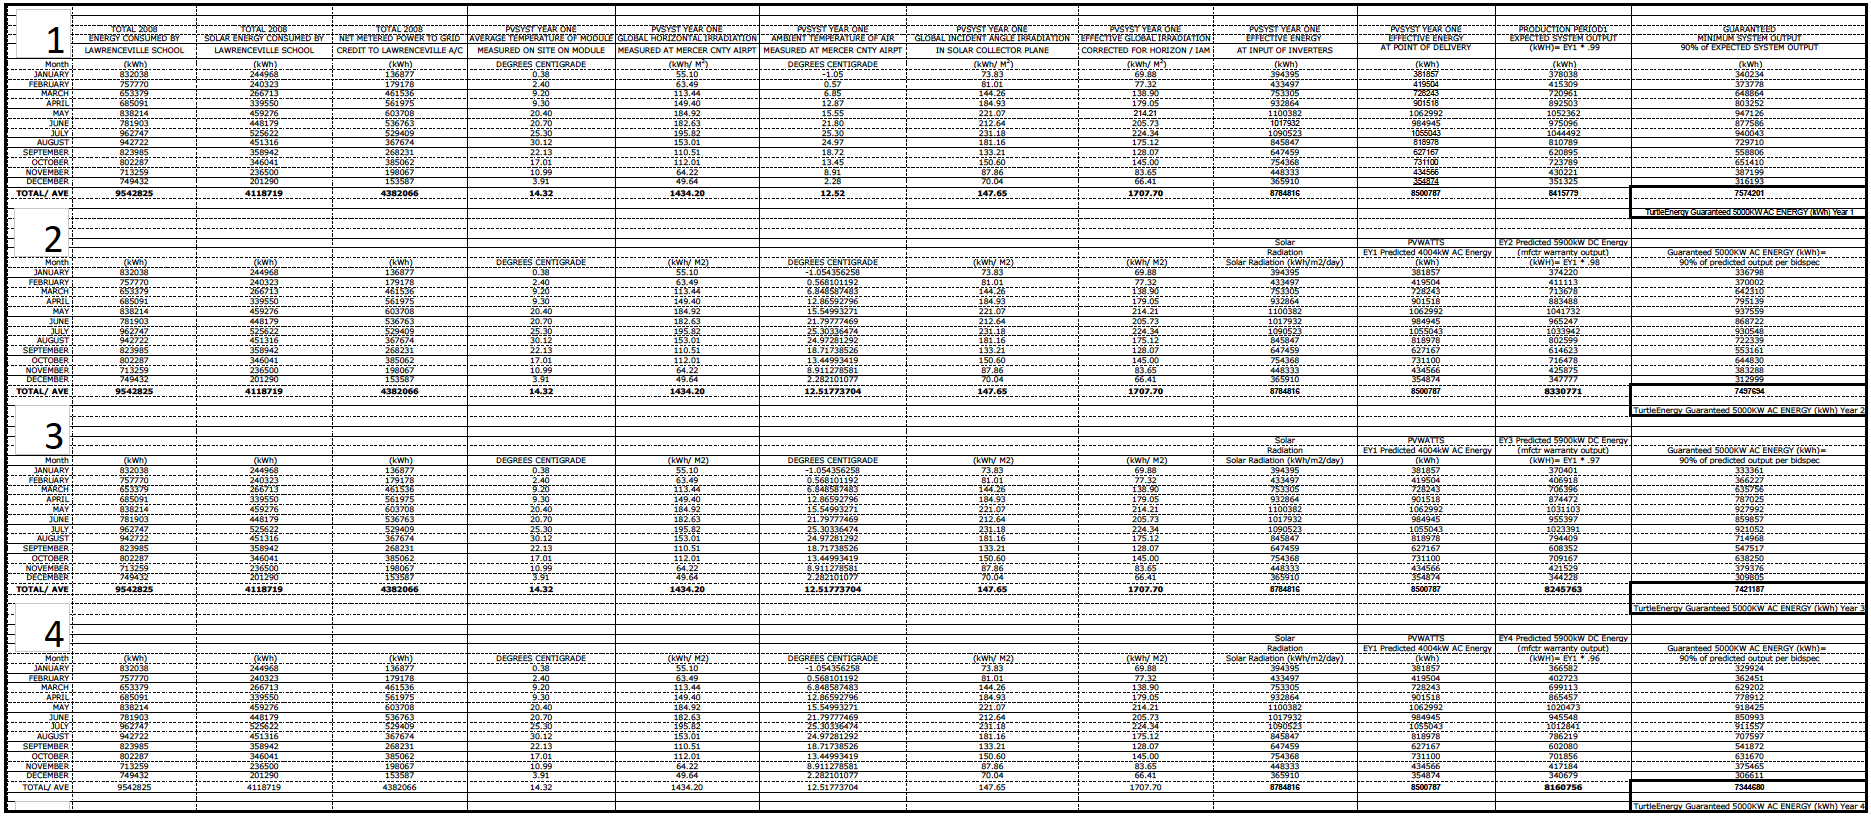
Table 4: Excerpt from energy production guaranty, a 90% of weather normalized guaranty of expected delivery according to PV Syst.
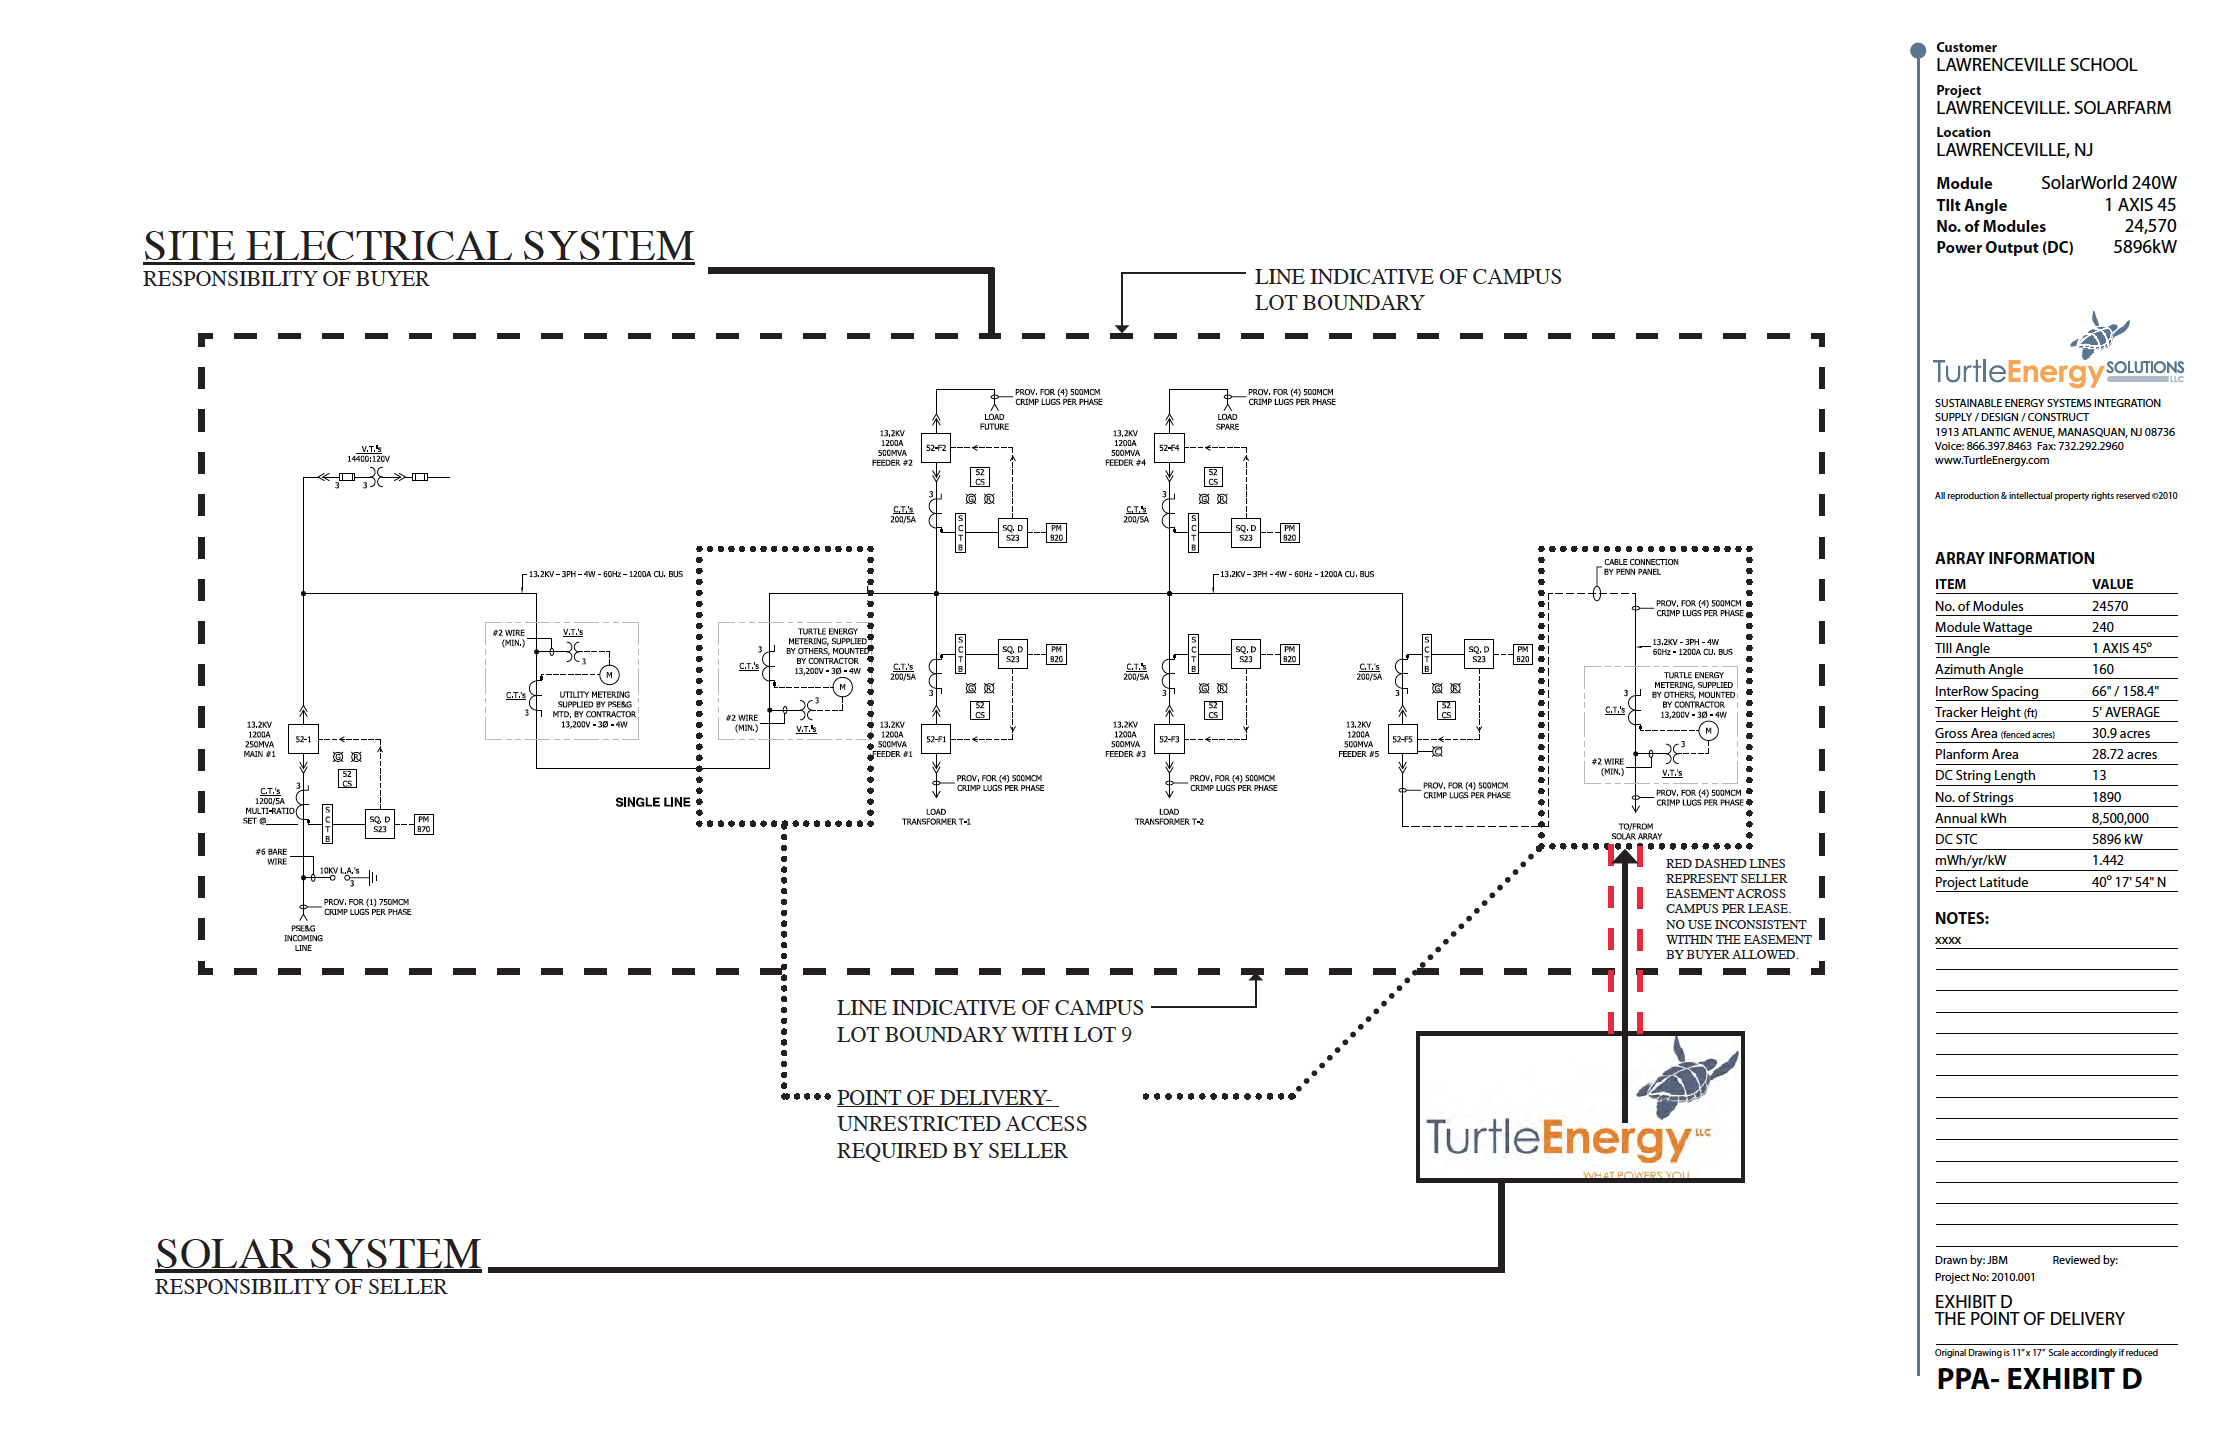
Figure 4: Electrical single line diagram indicating the exact location where the electrical connection would inject power from the Sun Farm.
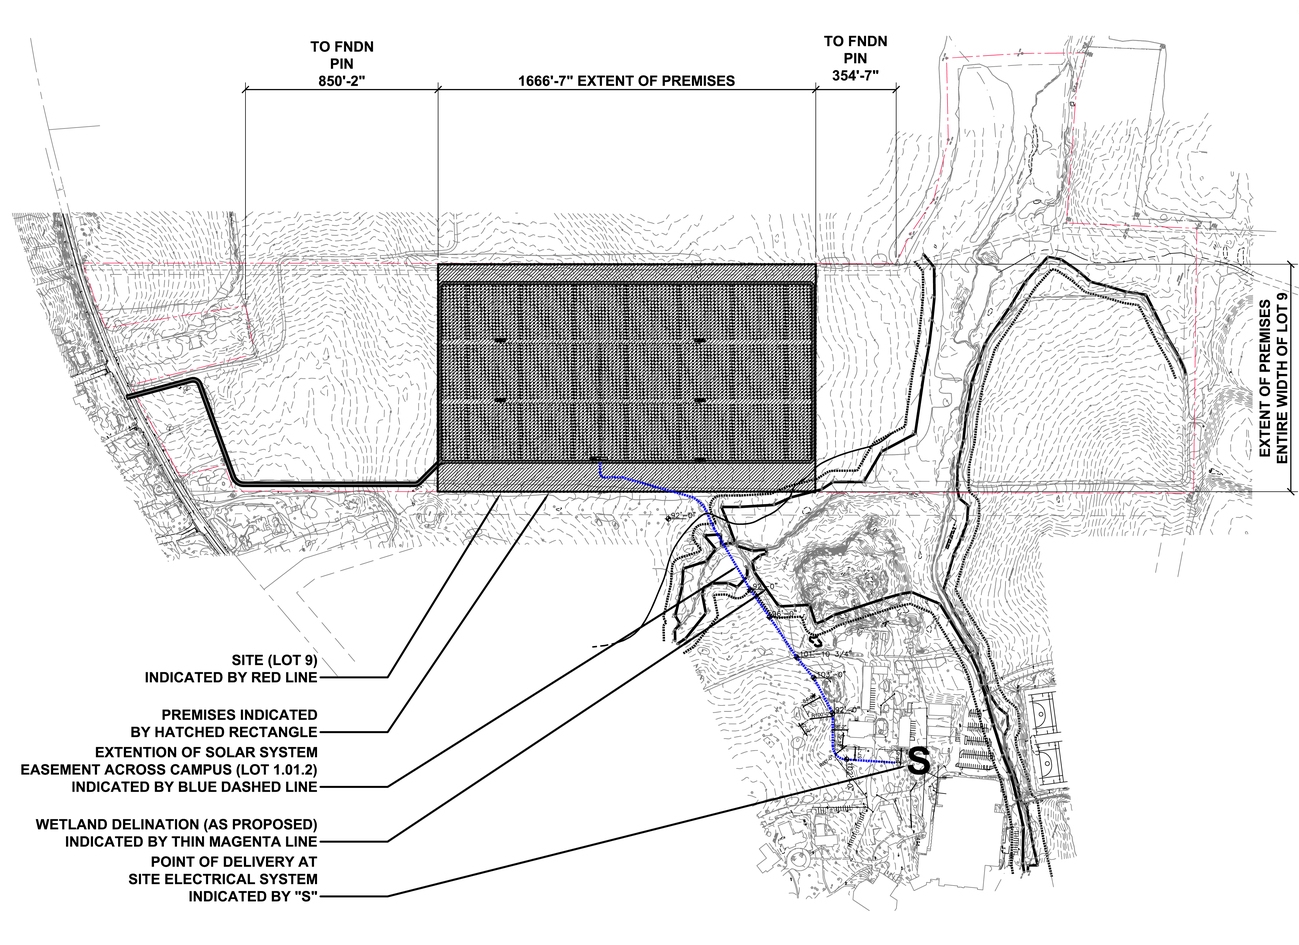
Figure 5: Description of the Premises that is subject to a lease of the land occupied by the 30 acre sun farm.
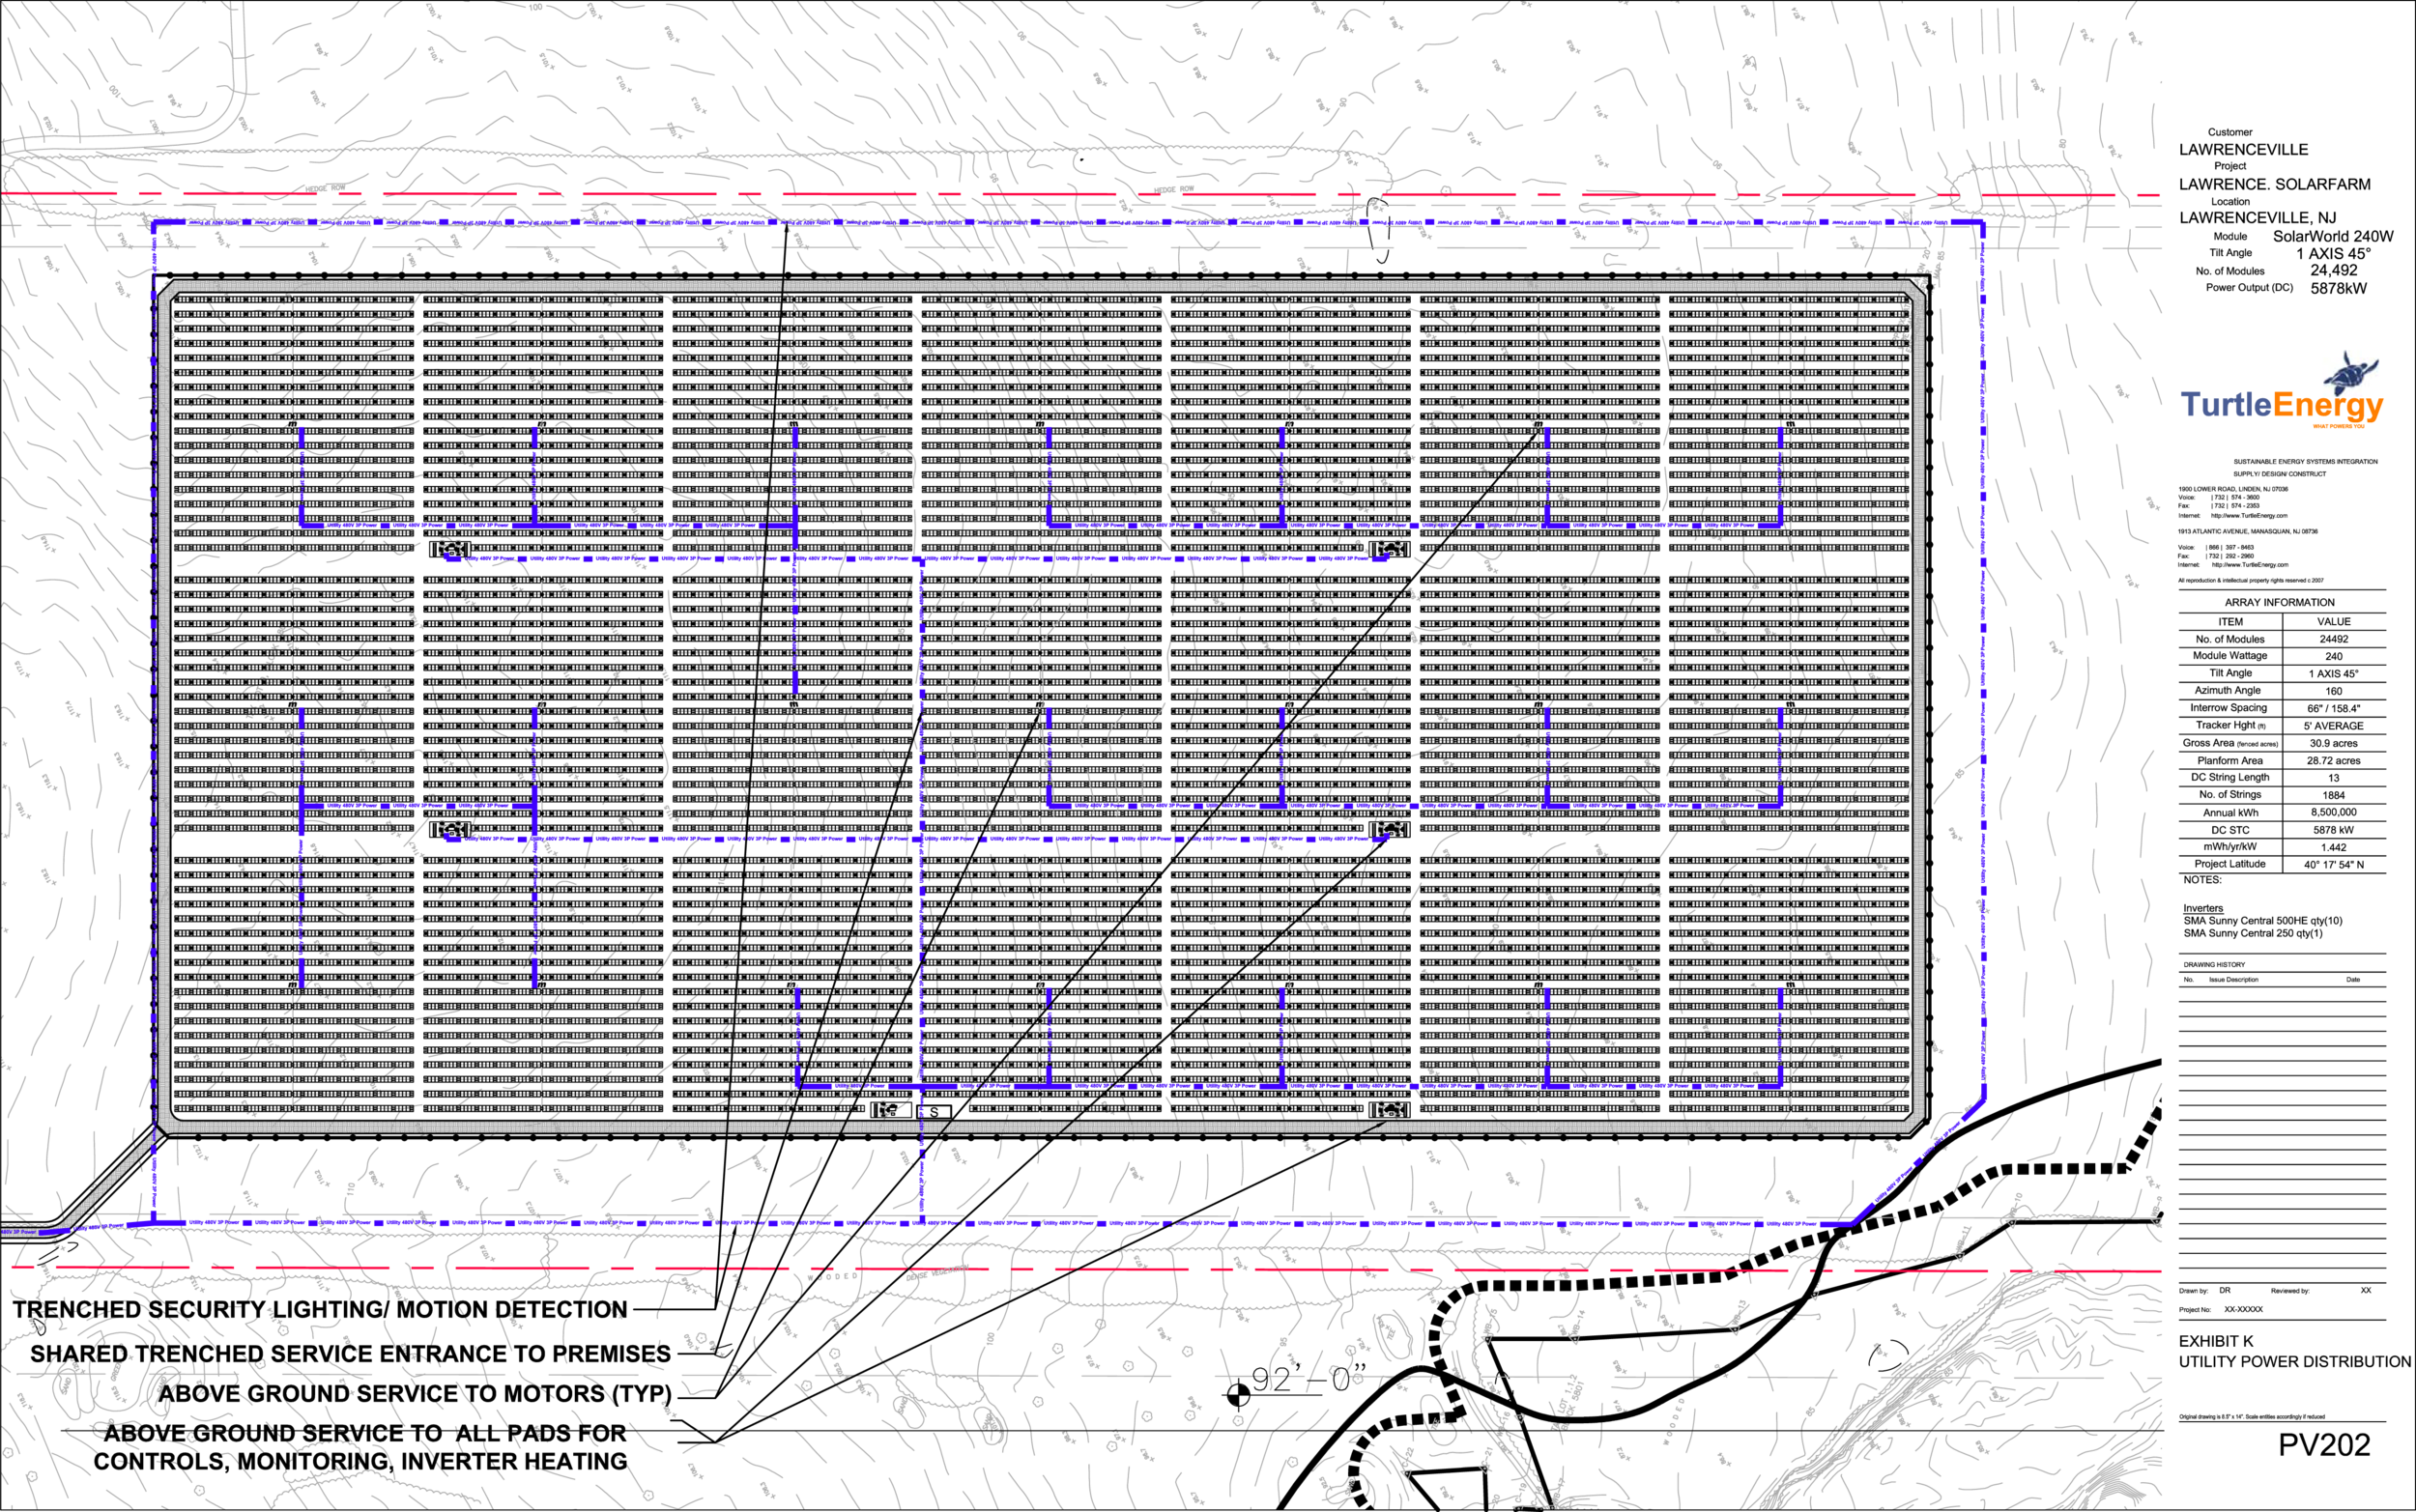
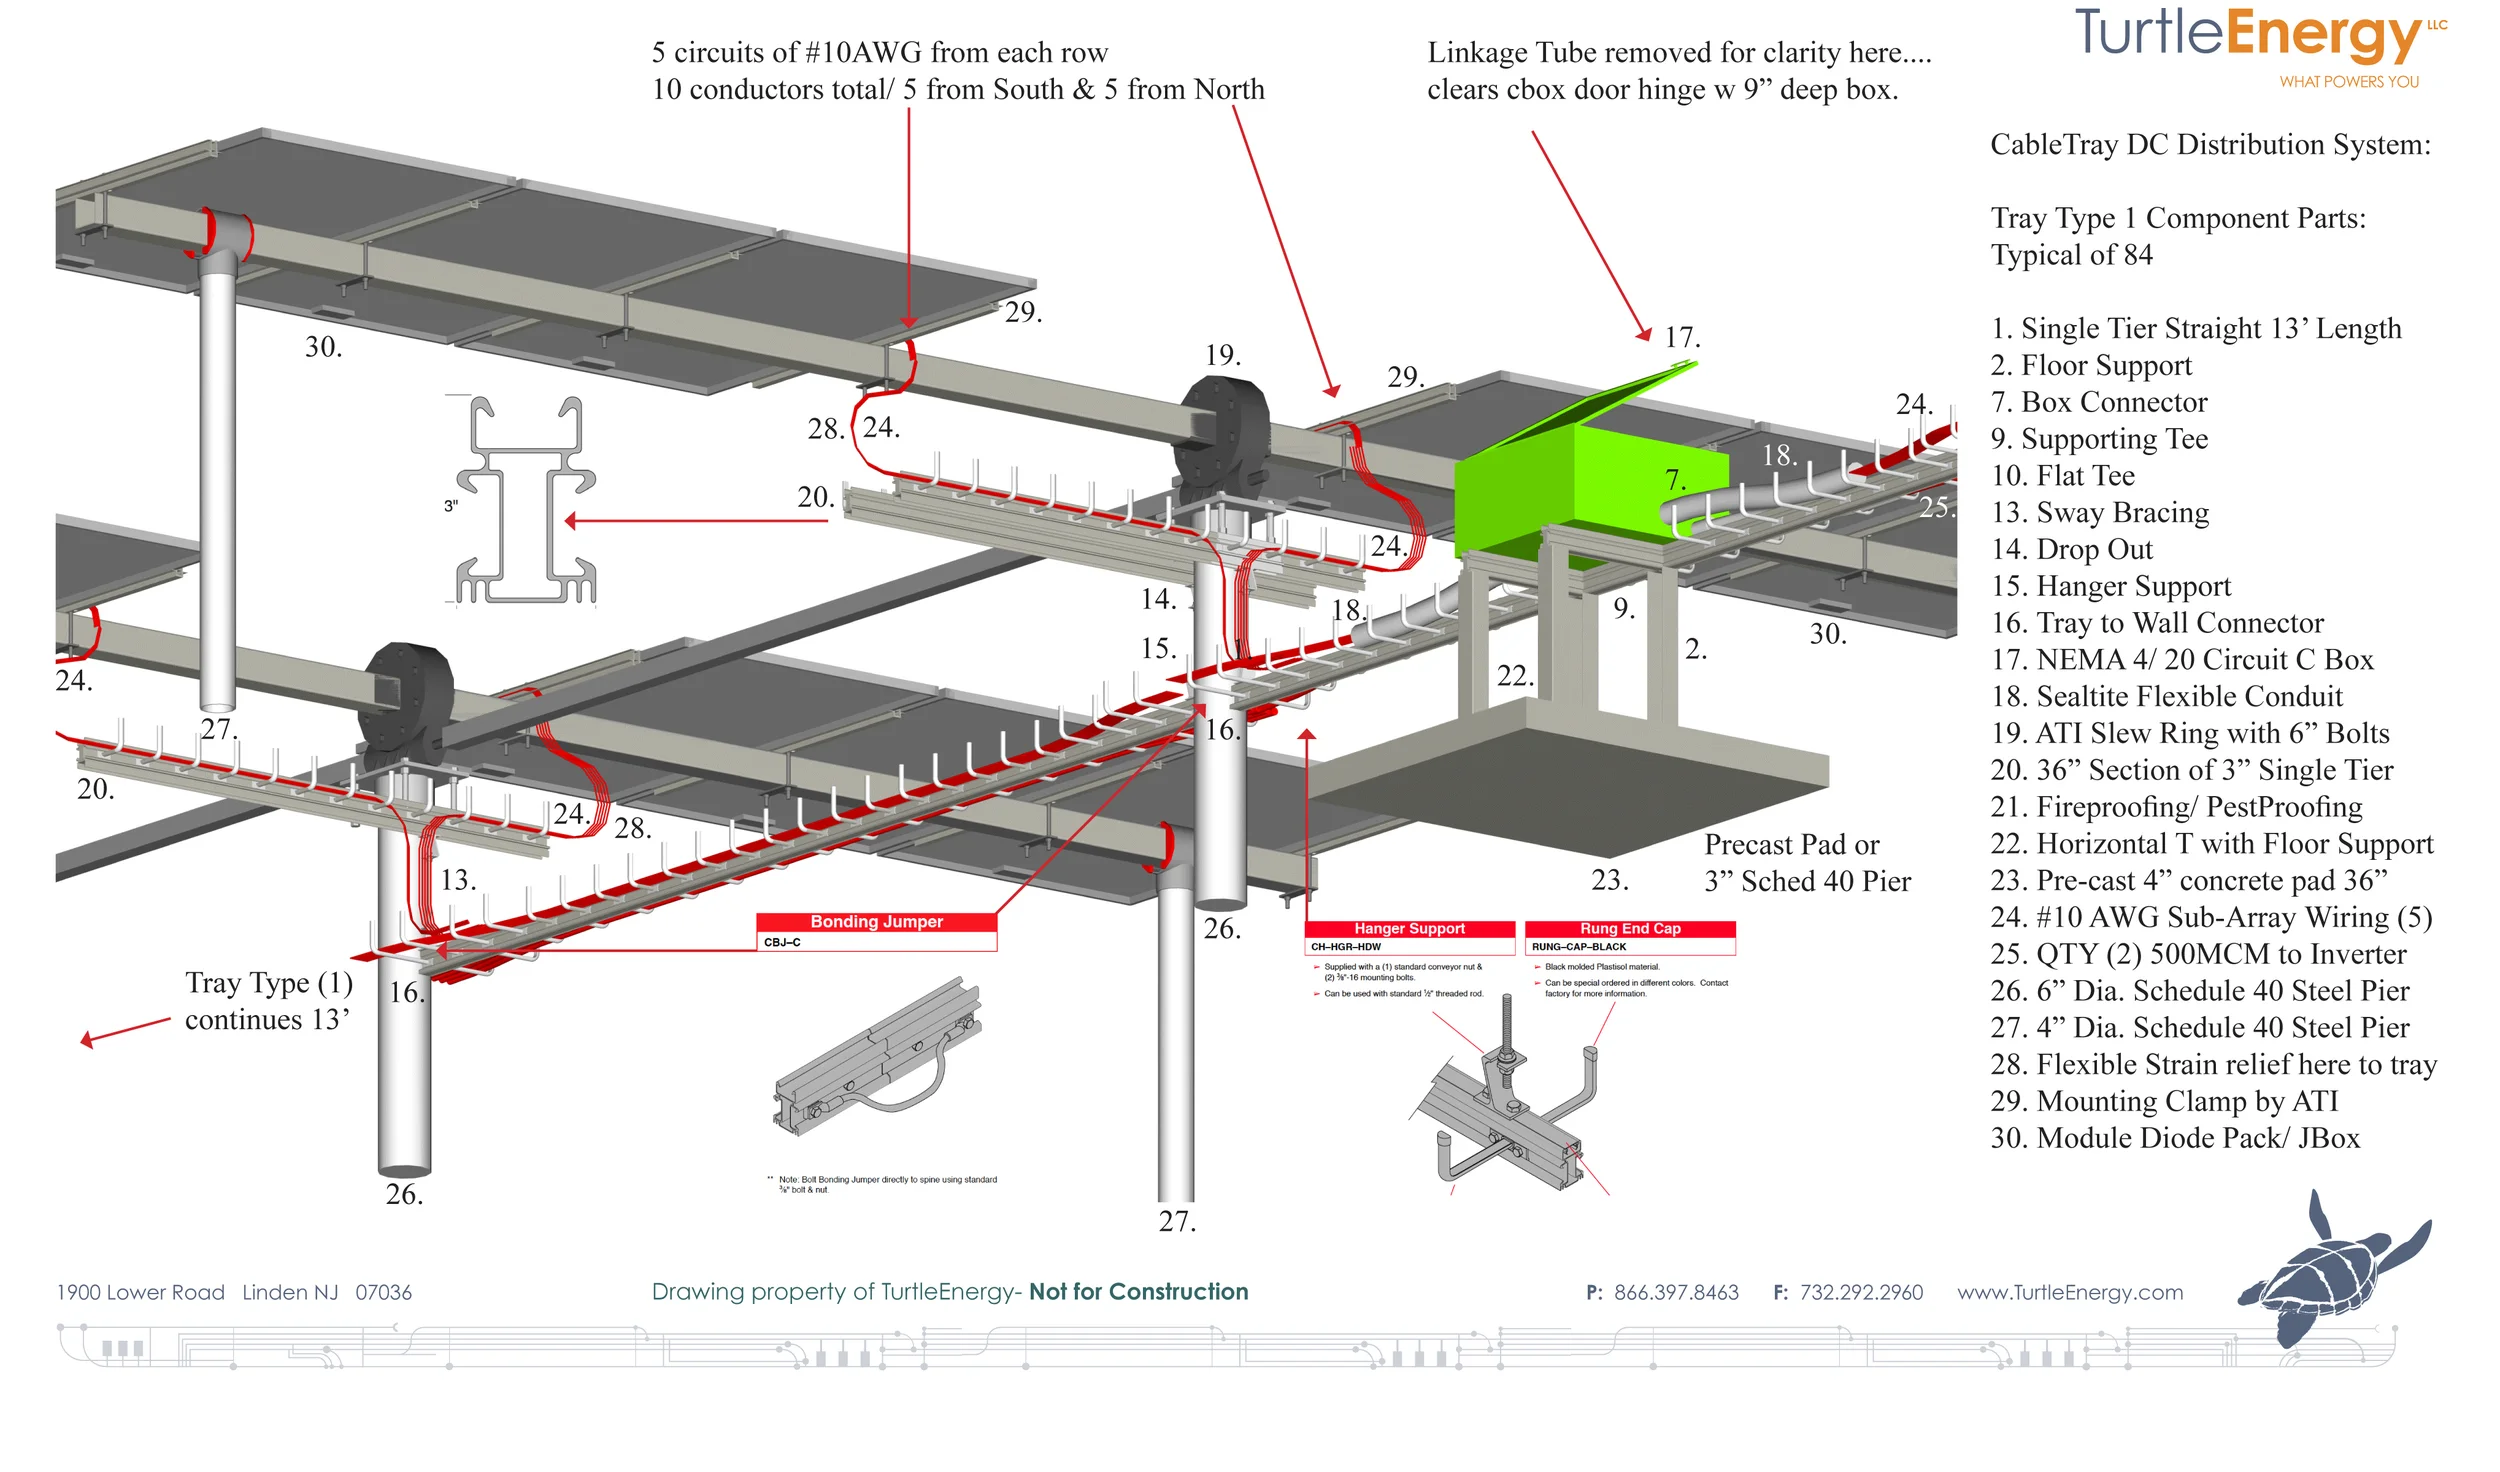
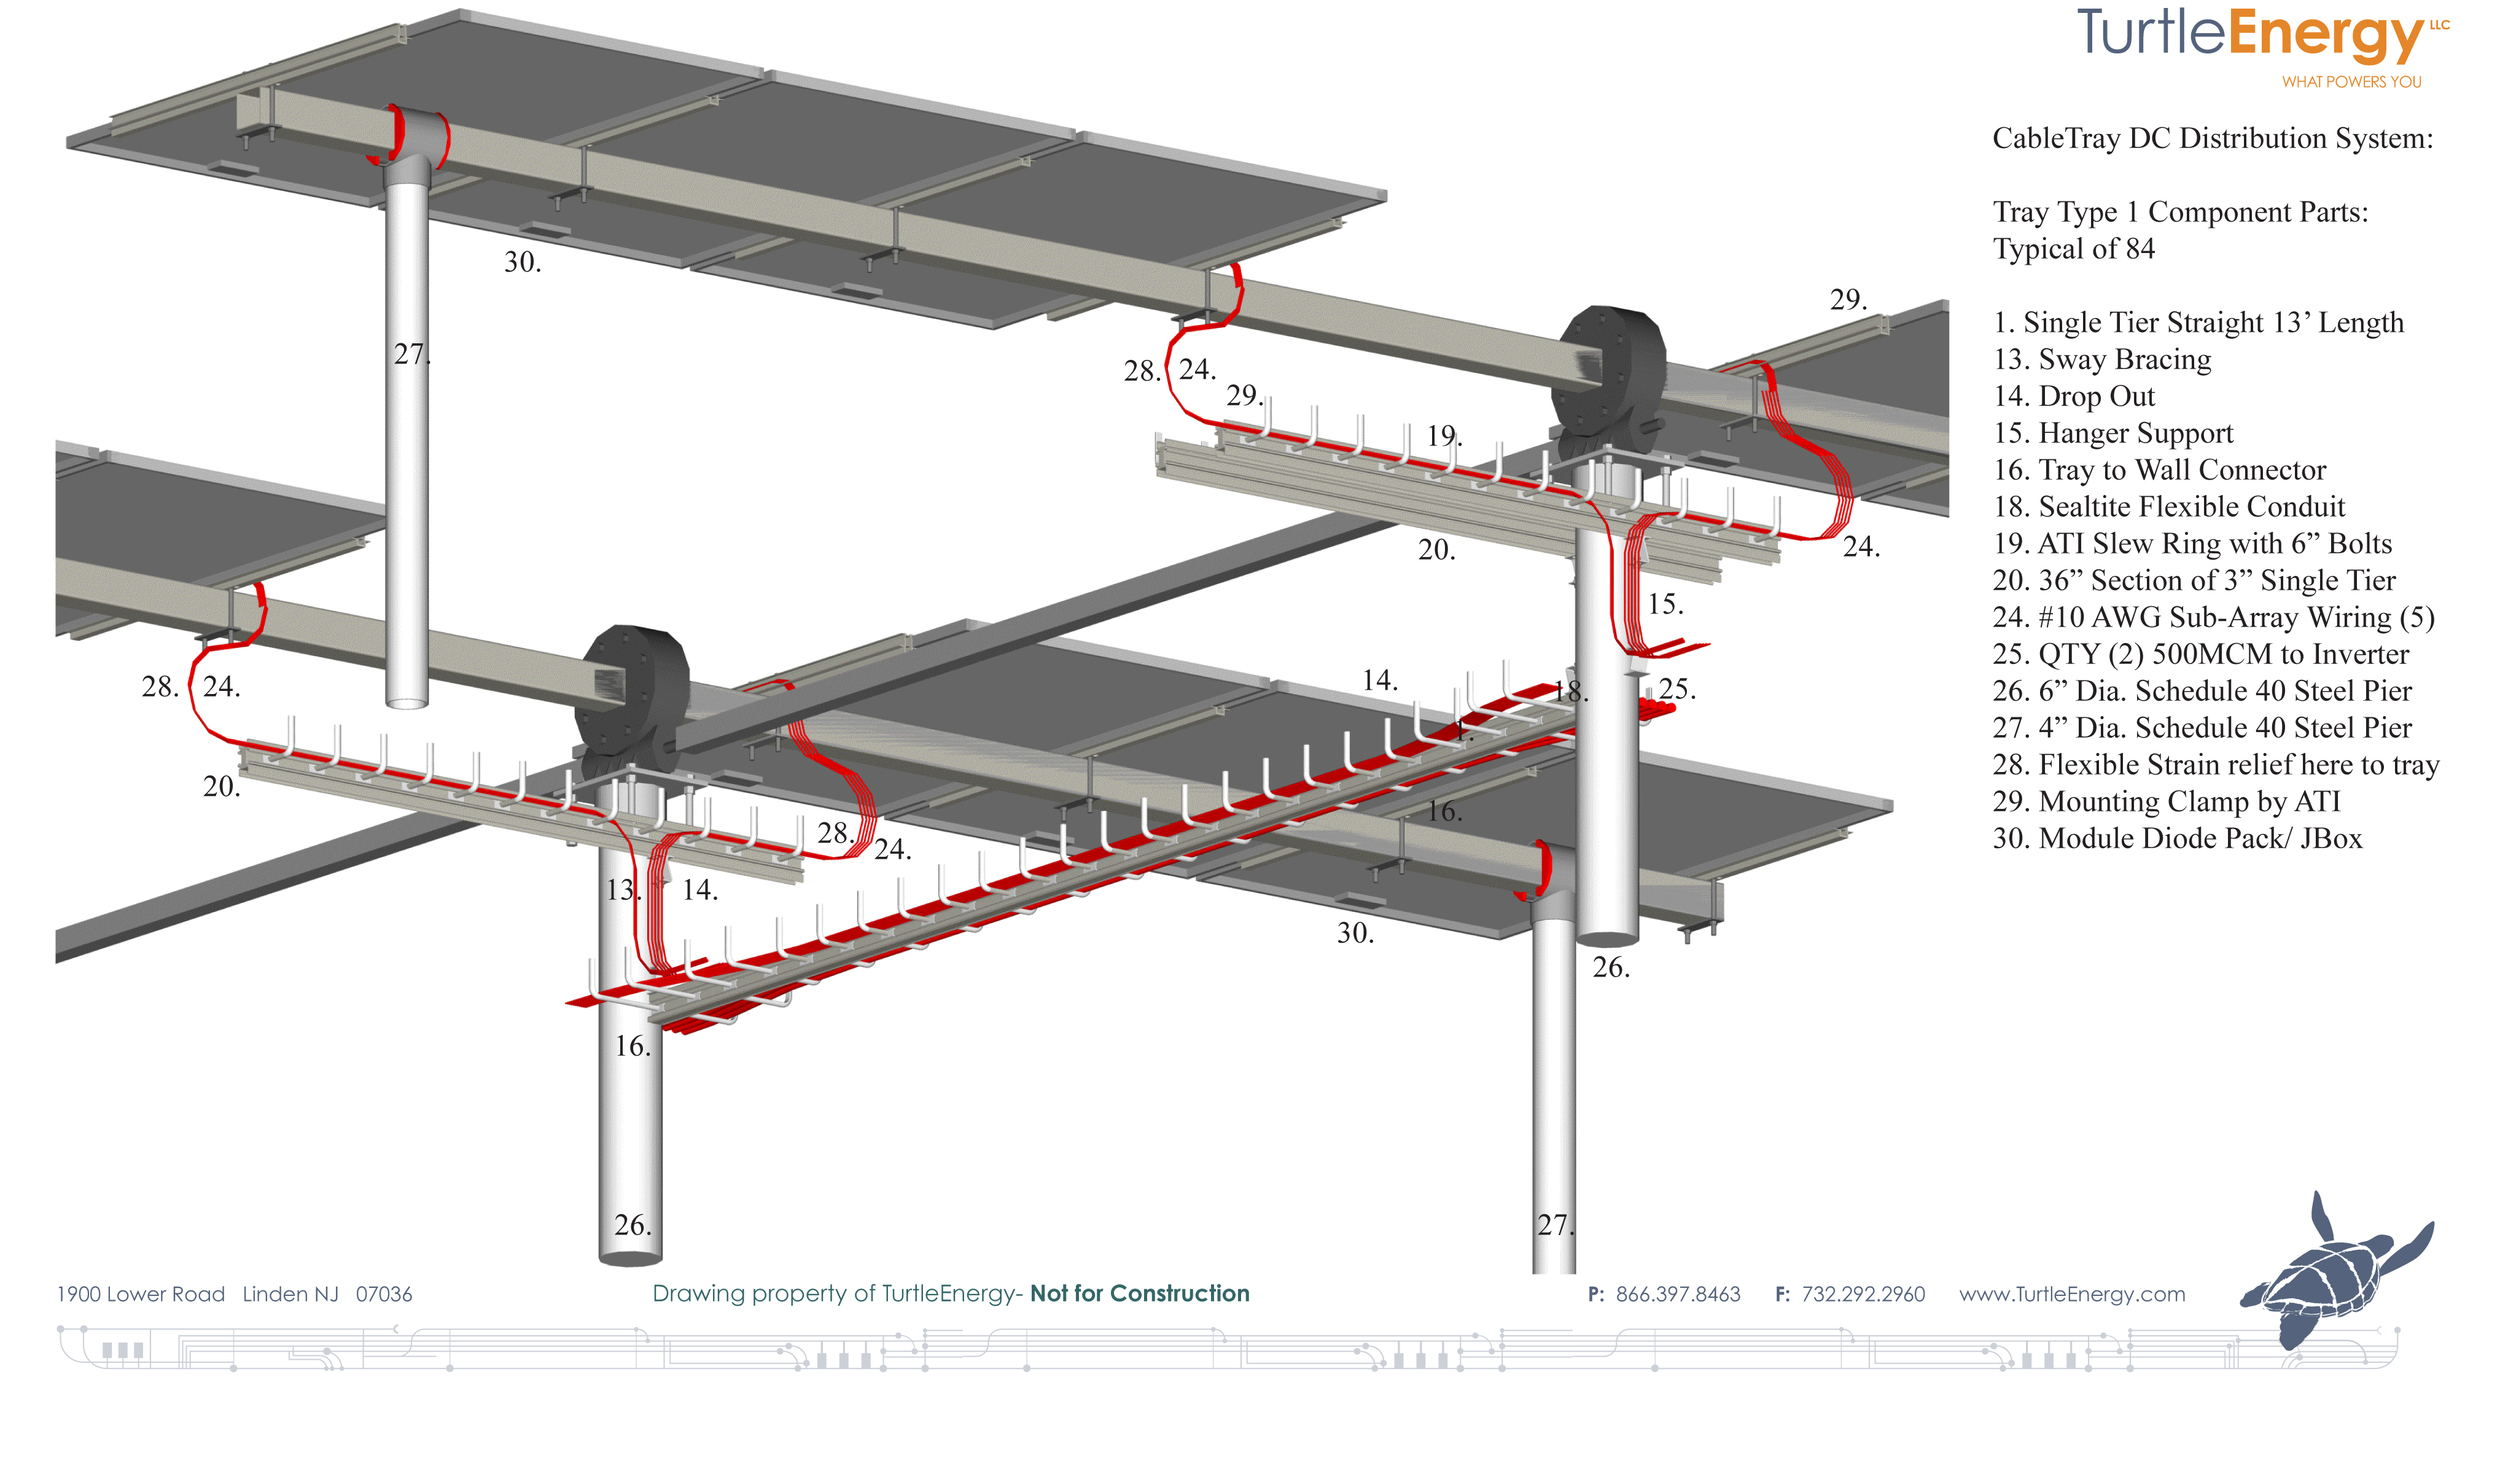
Figure 6: Blue Lines indicate distribution of AC power from inverters in trenches as well as control power to tracker motors on cable tray.
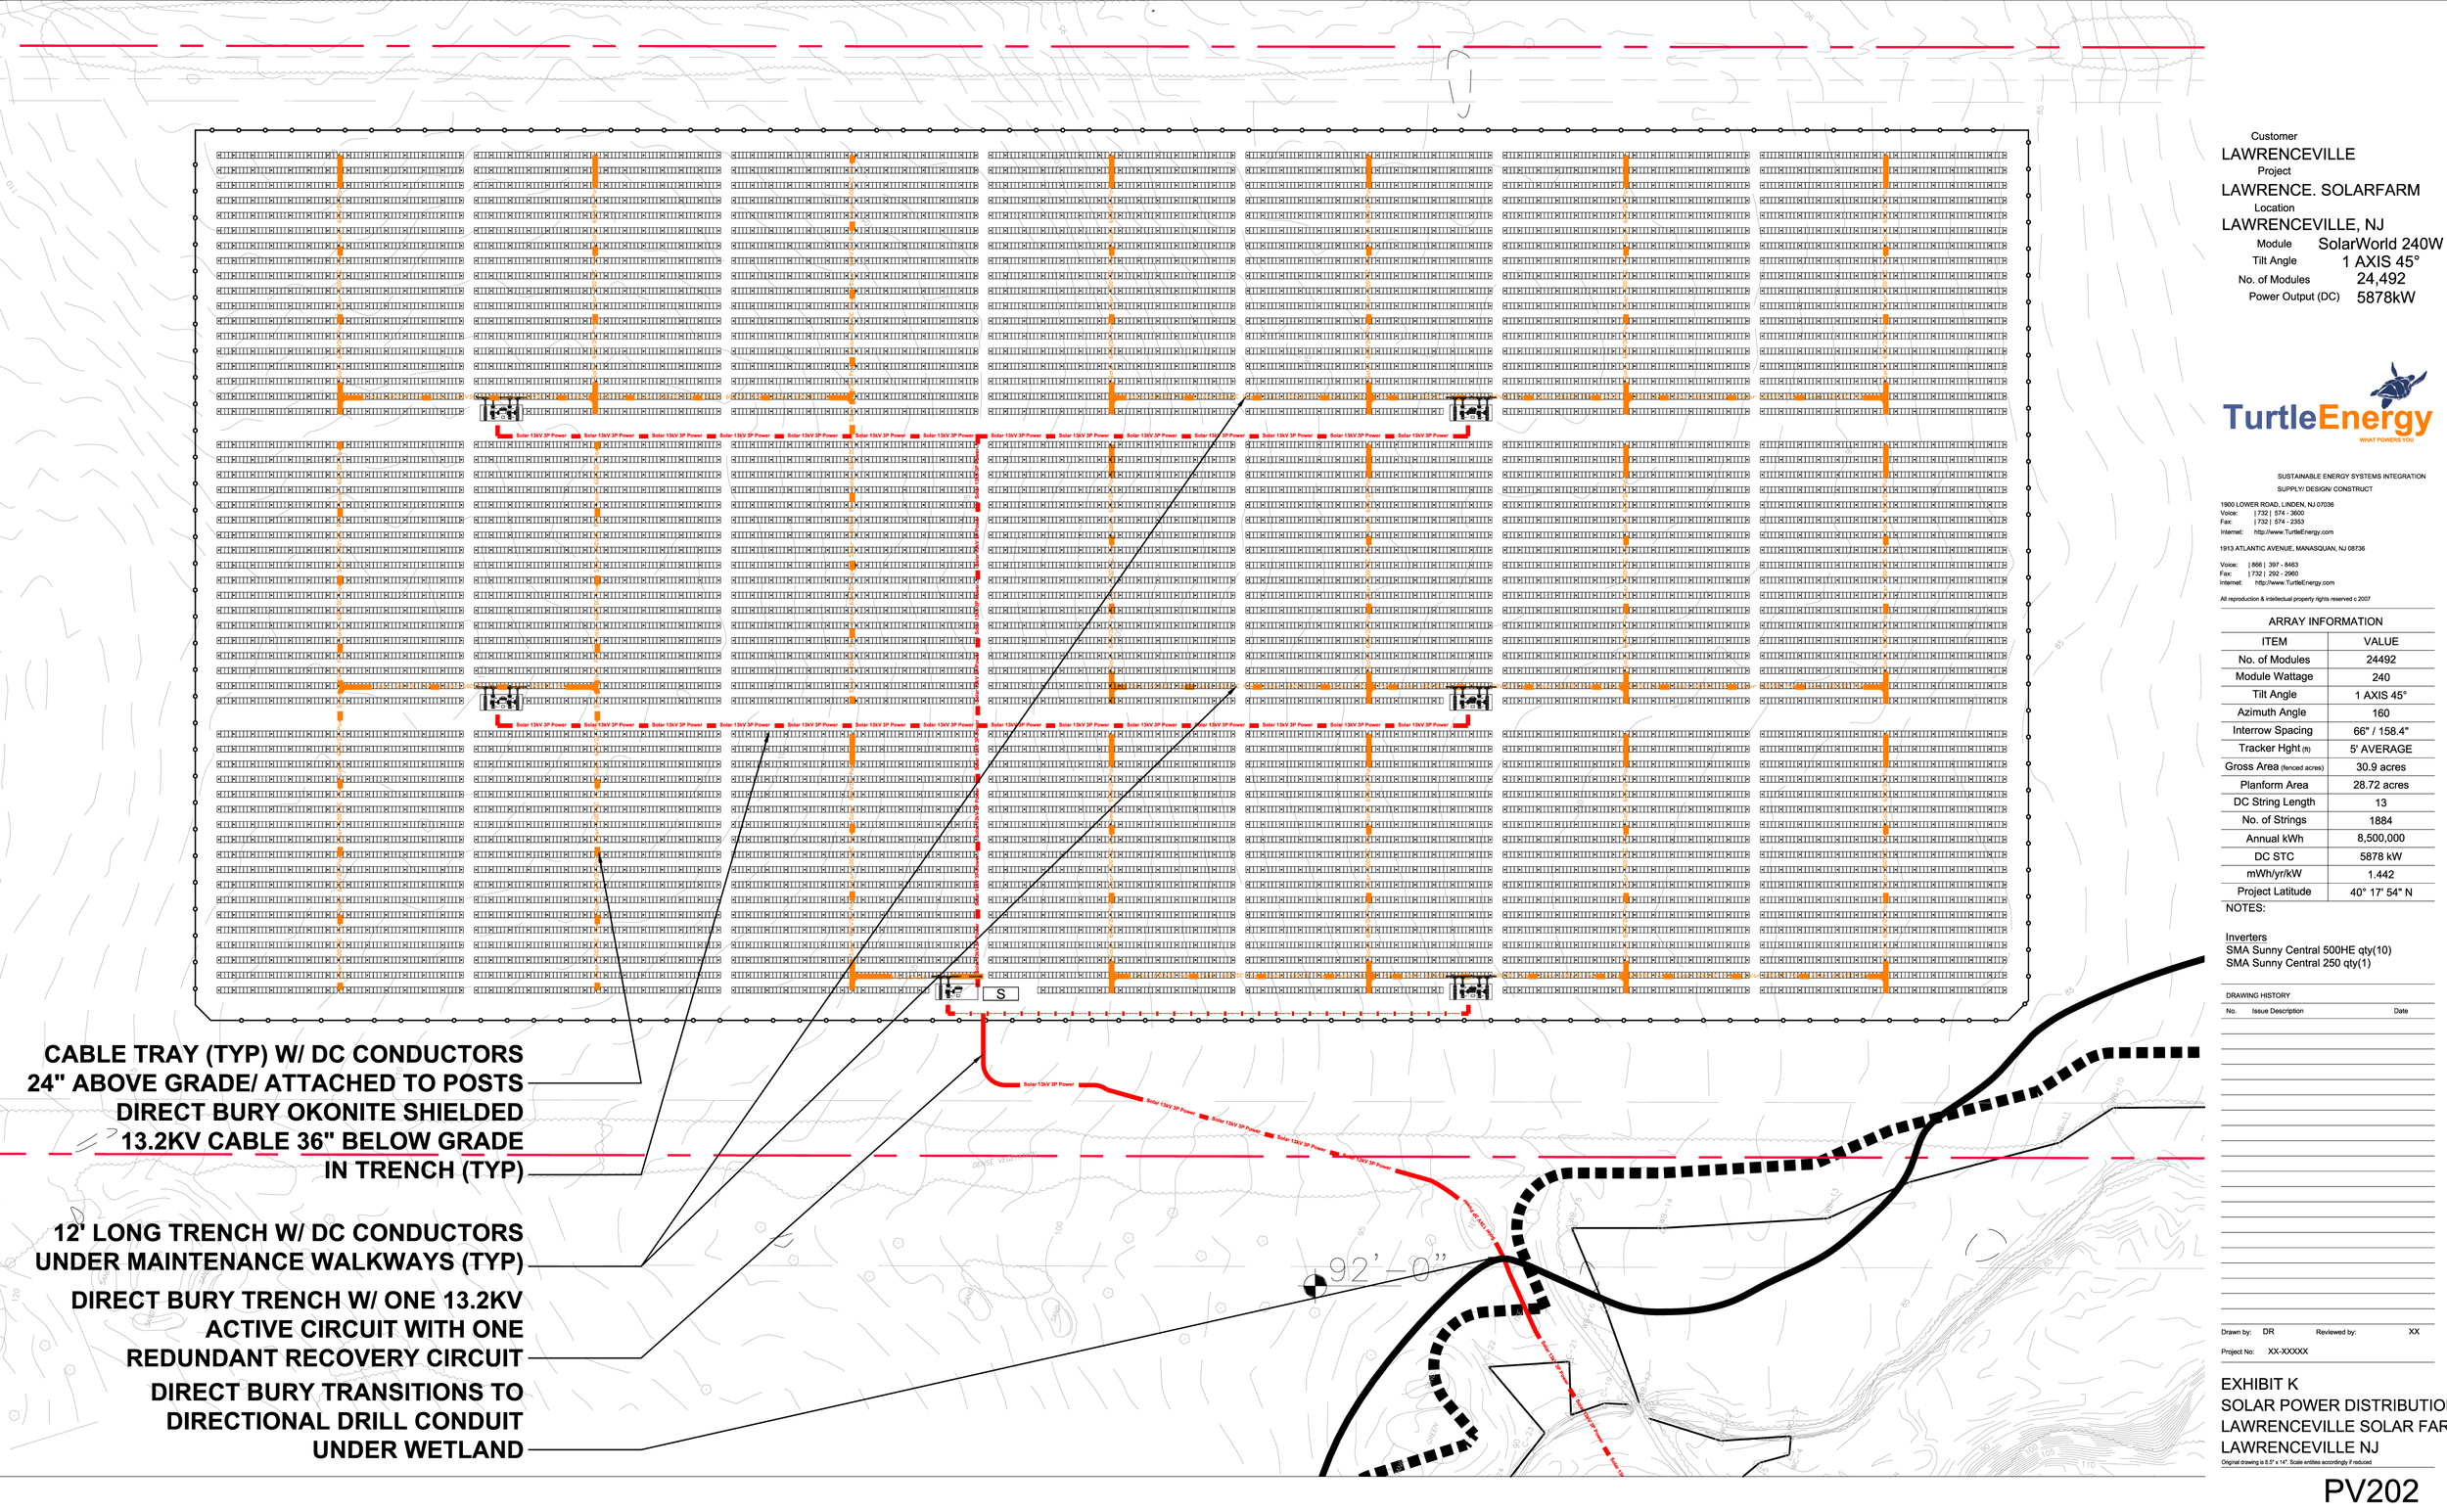
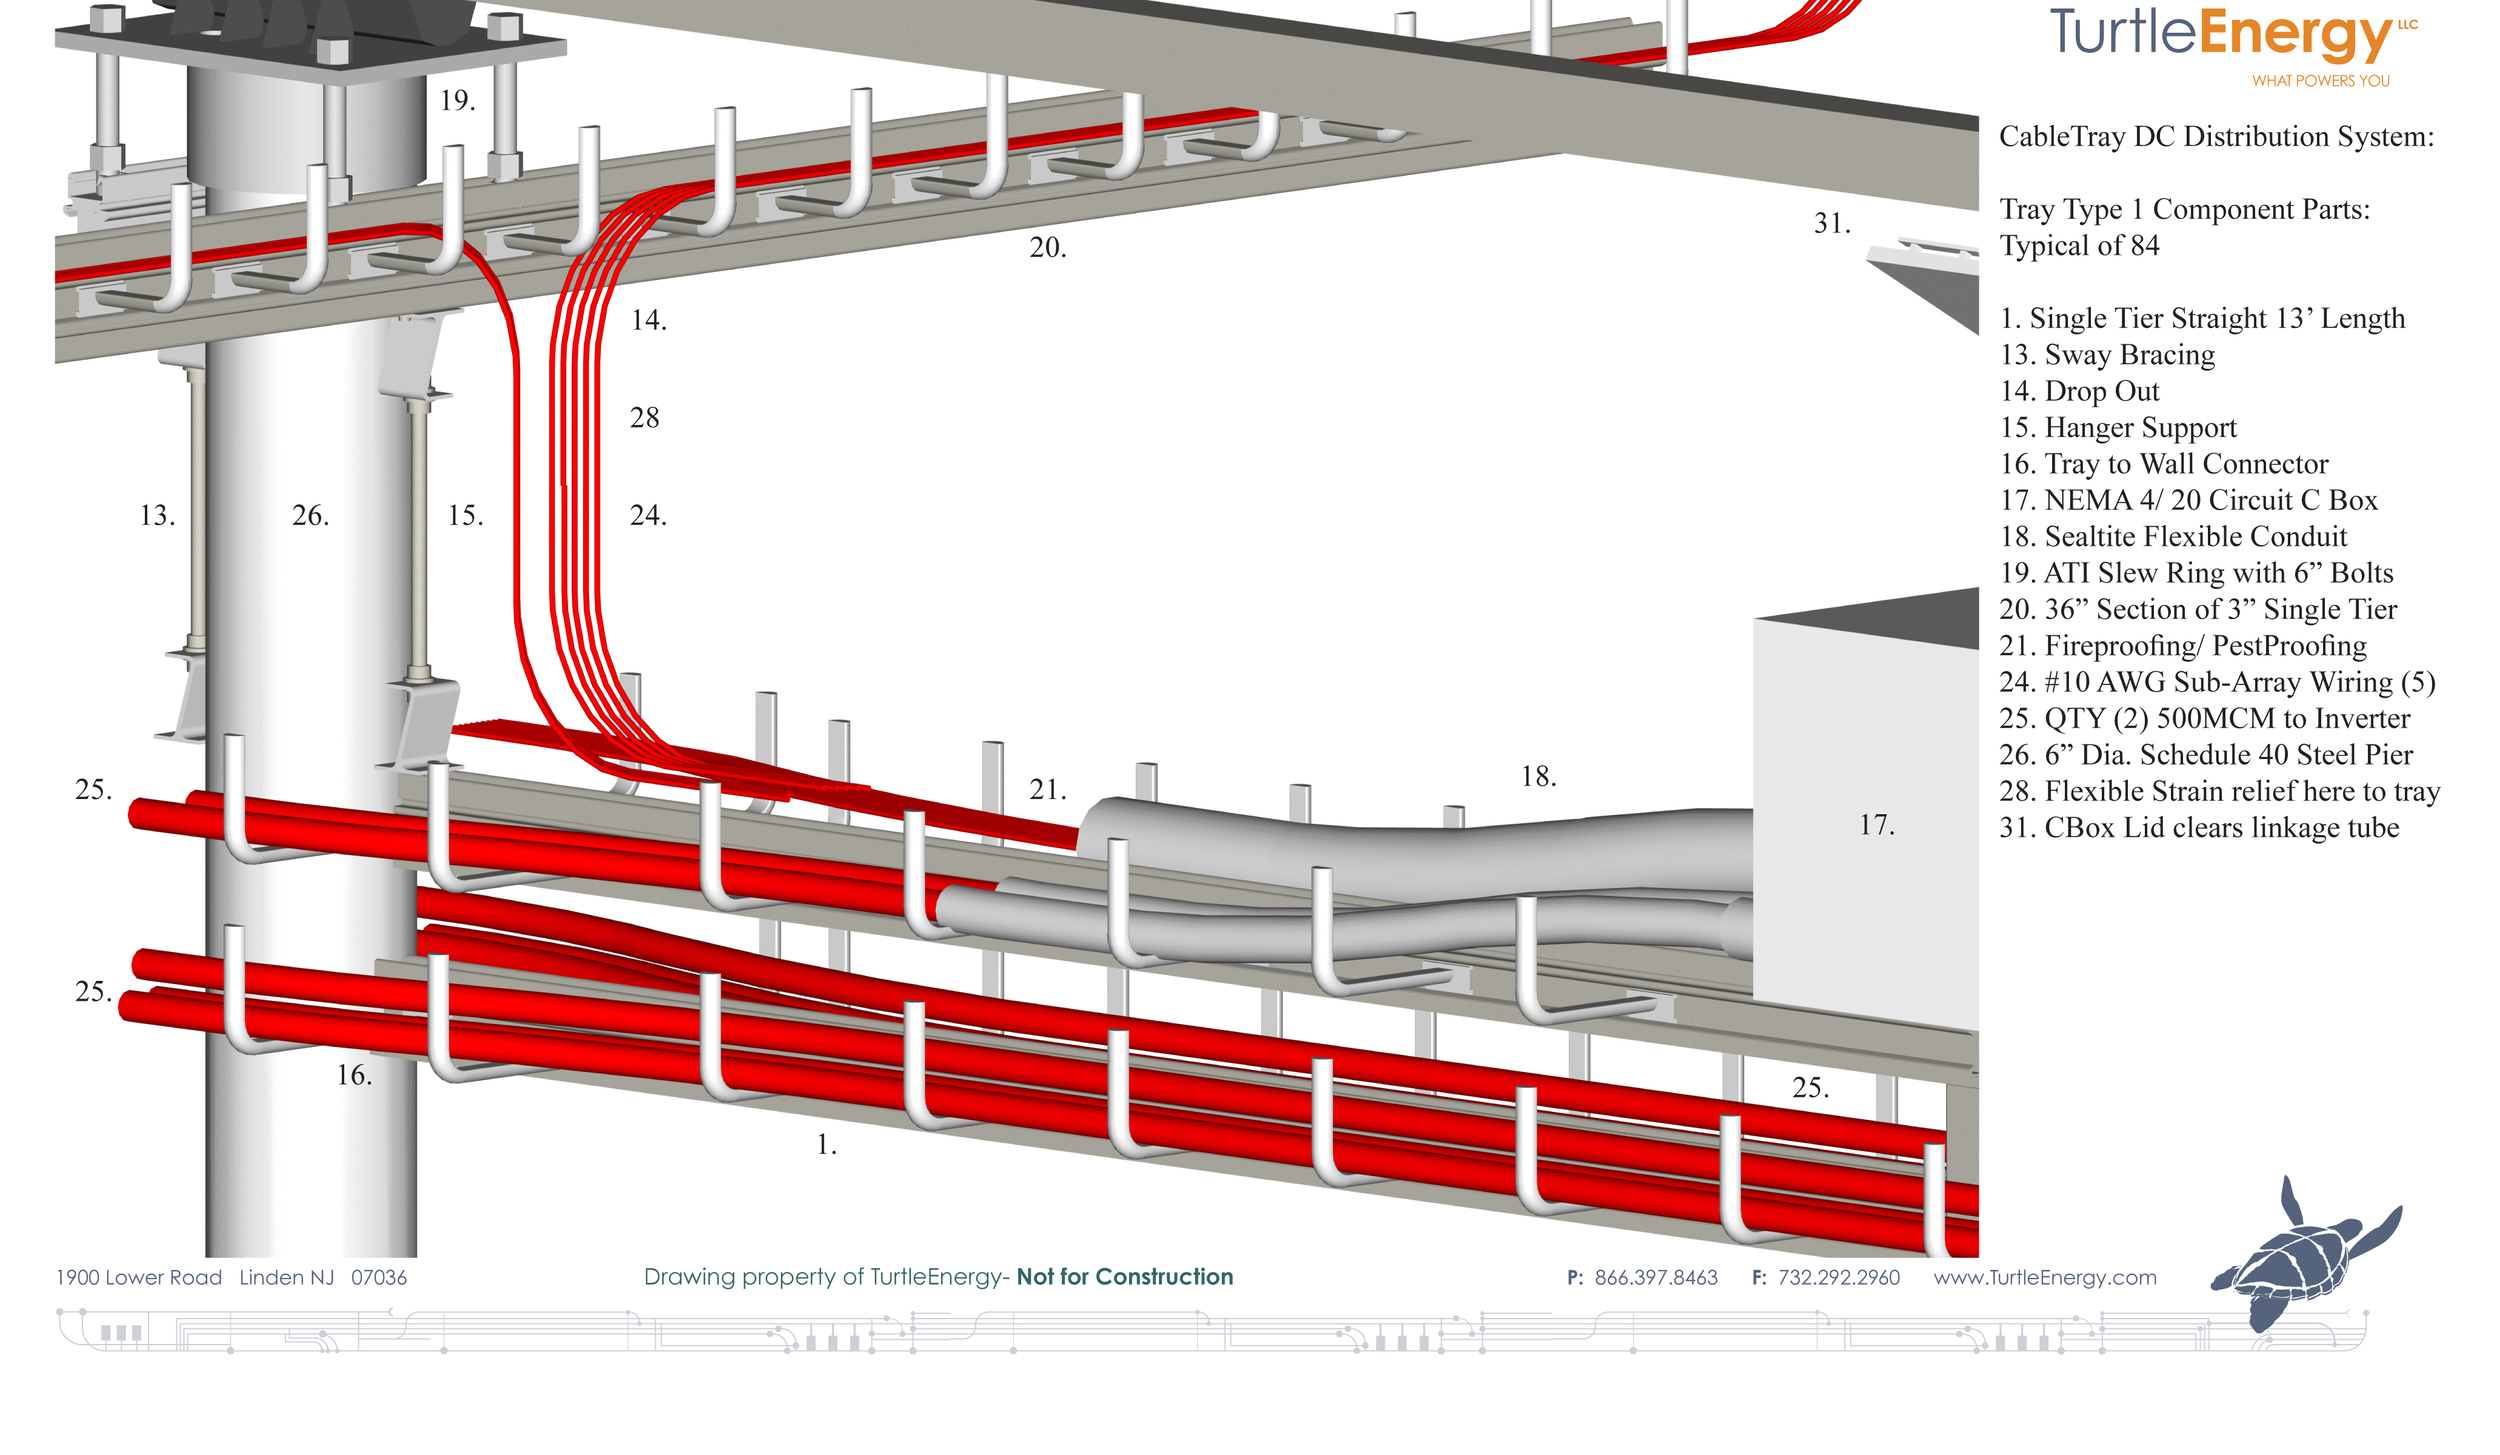
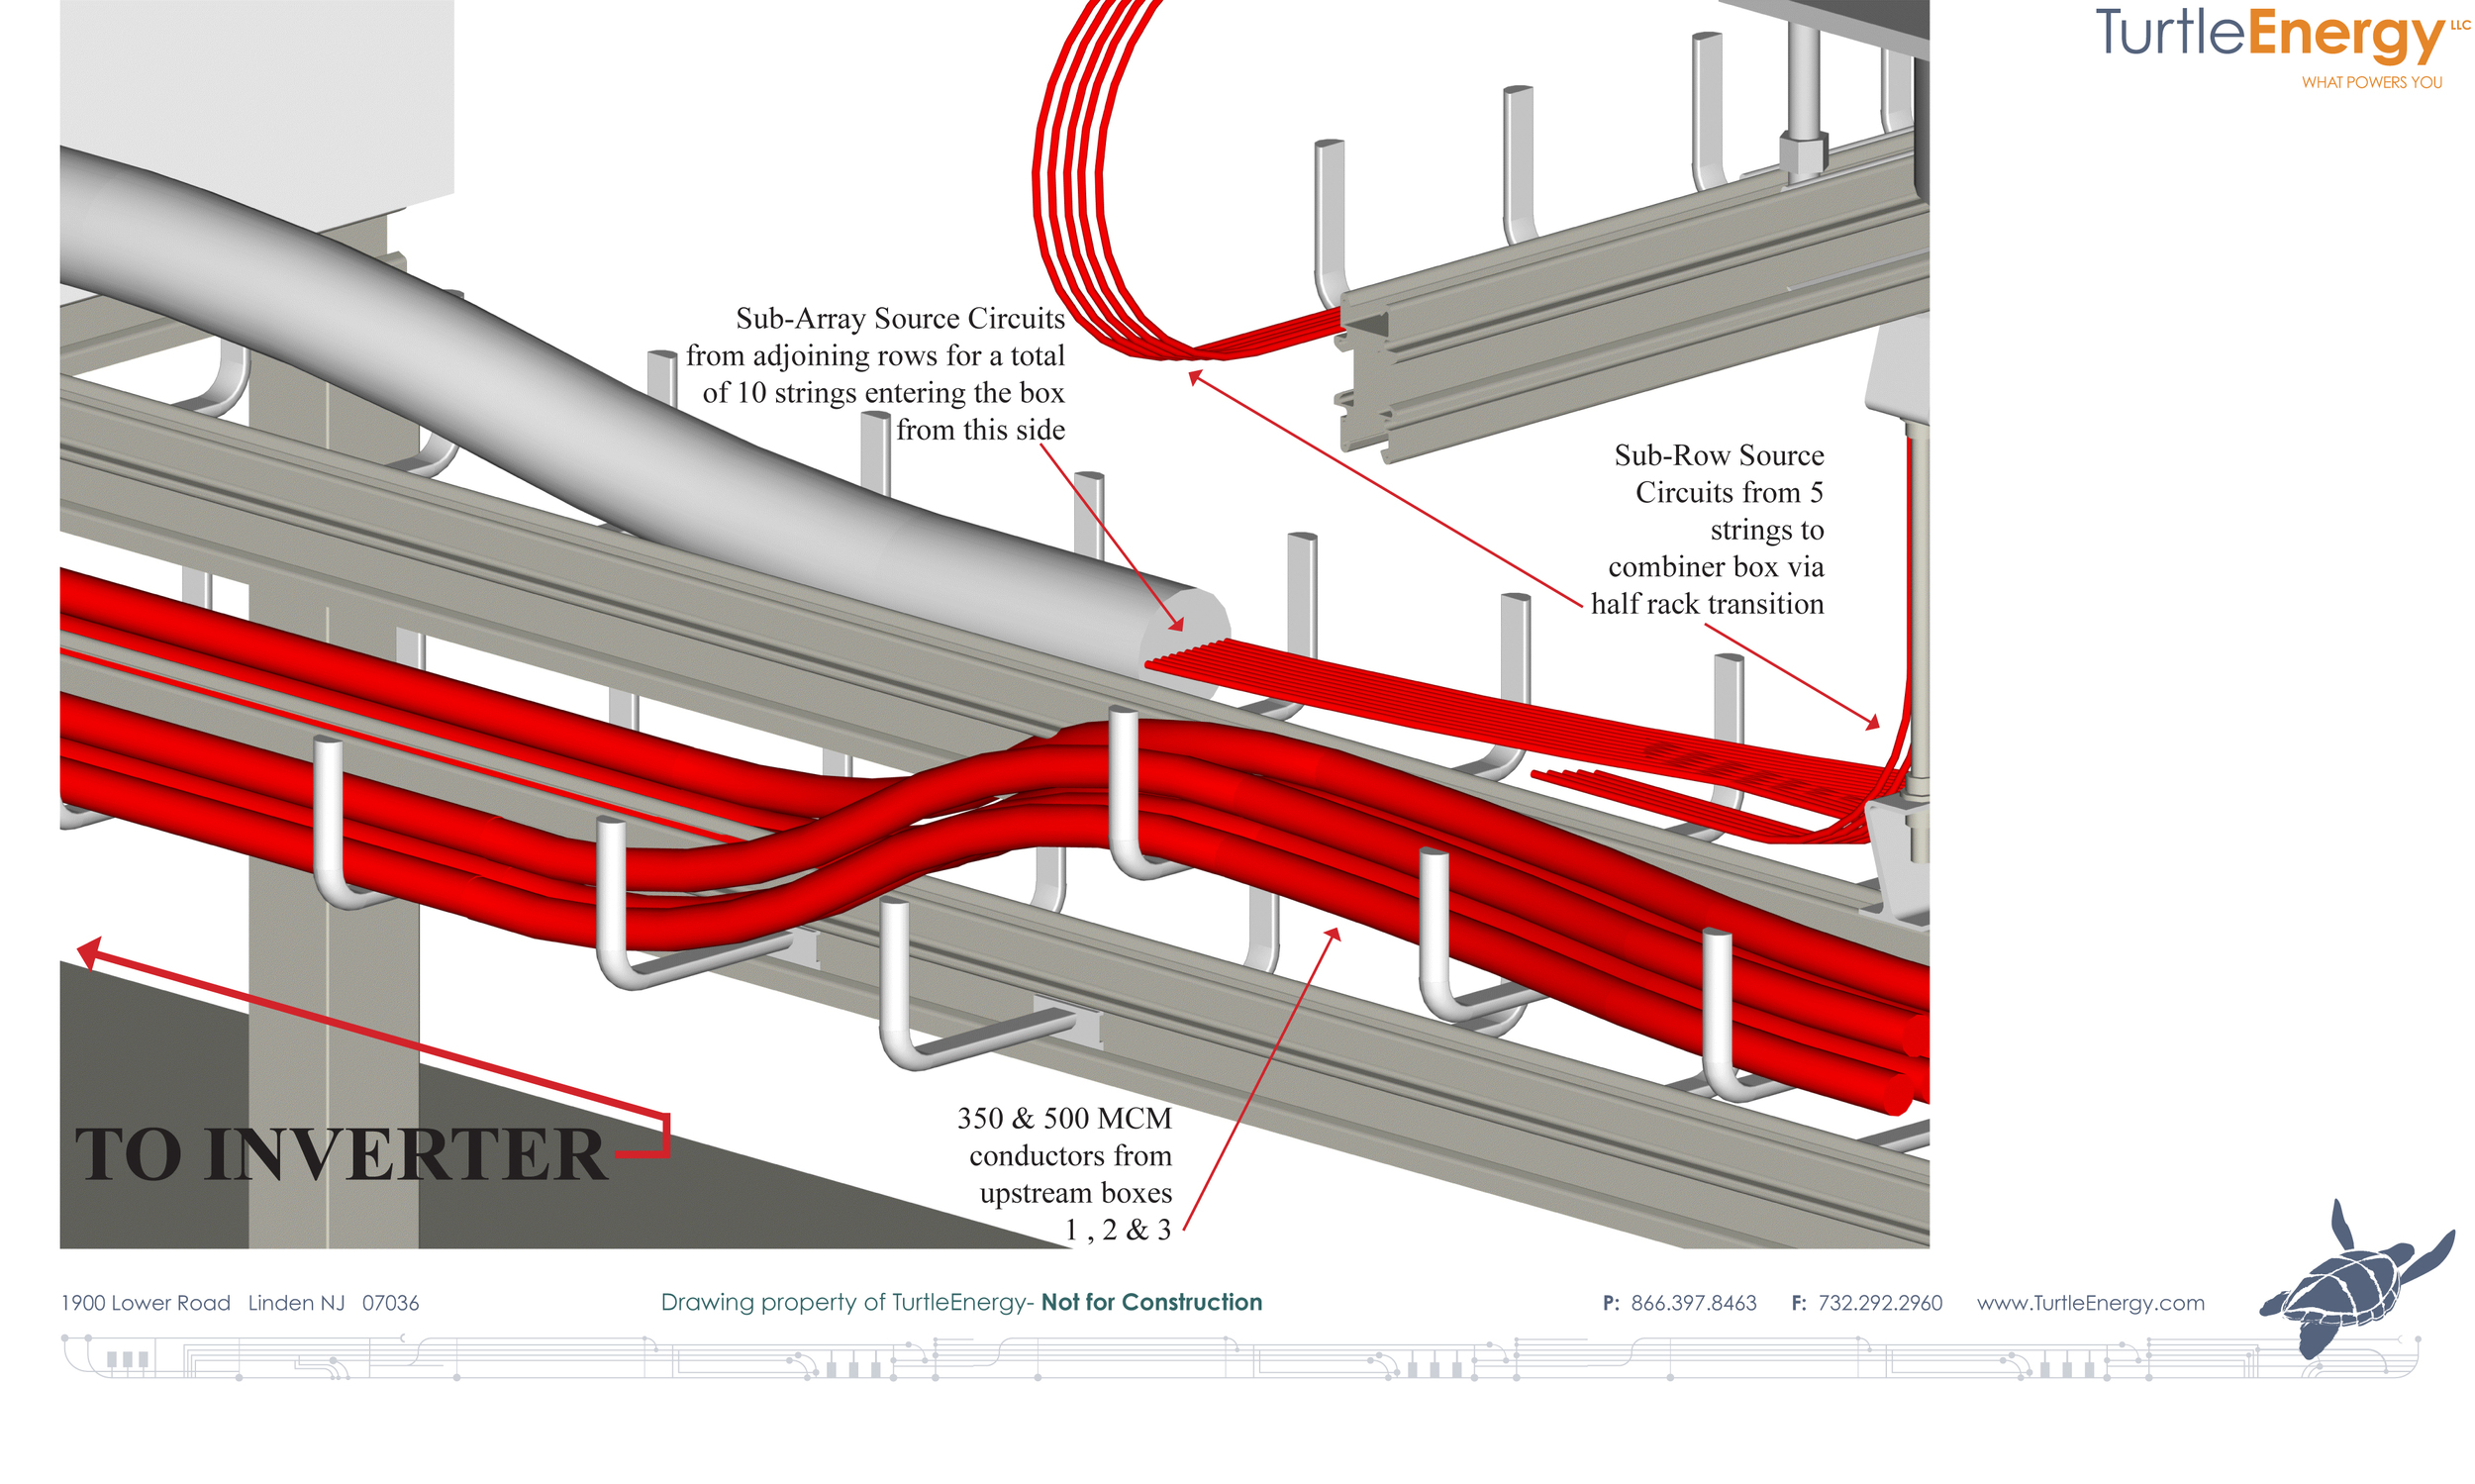
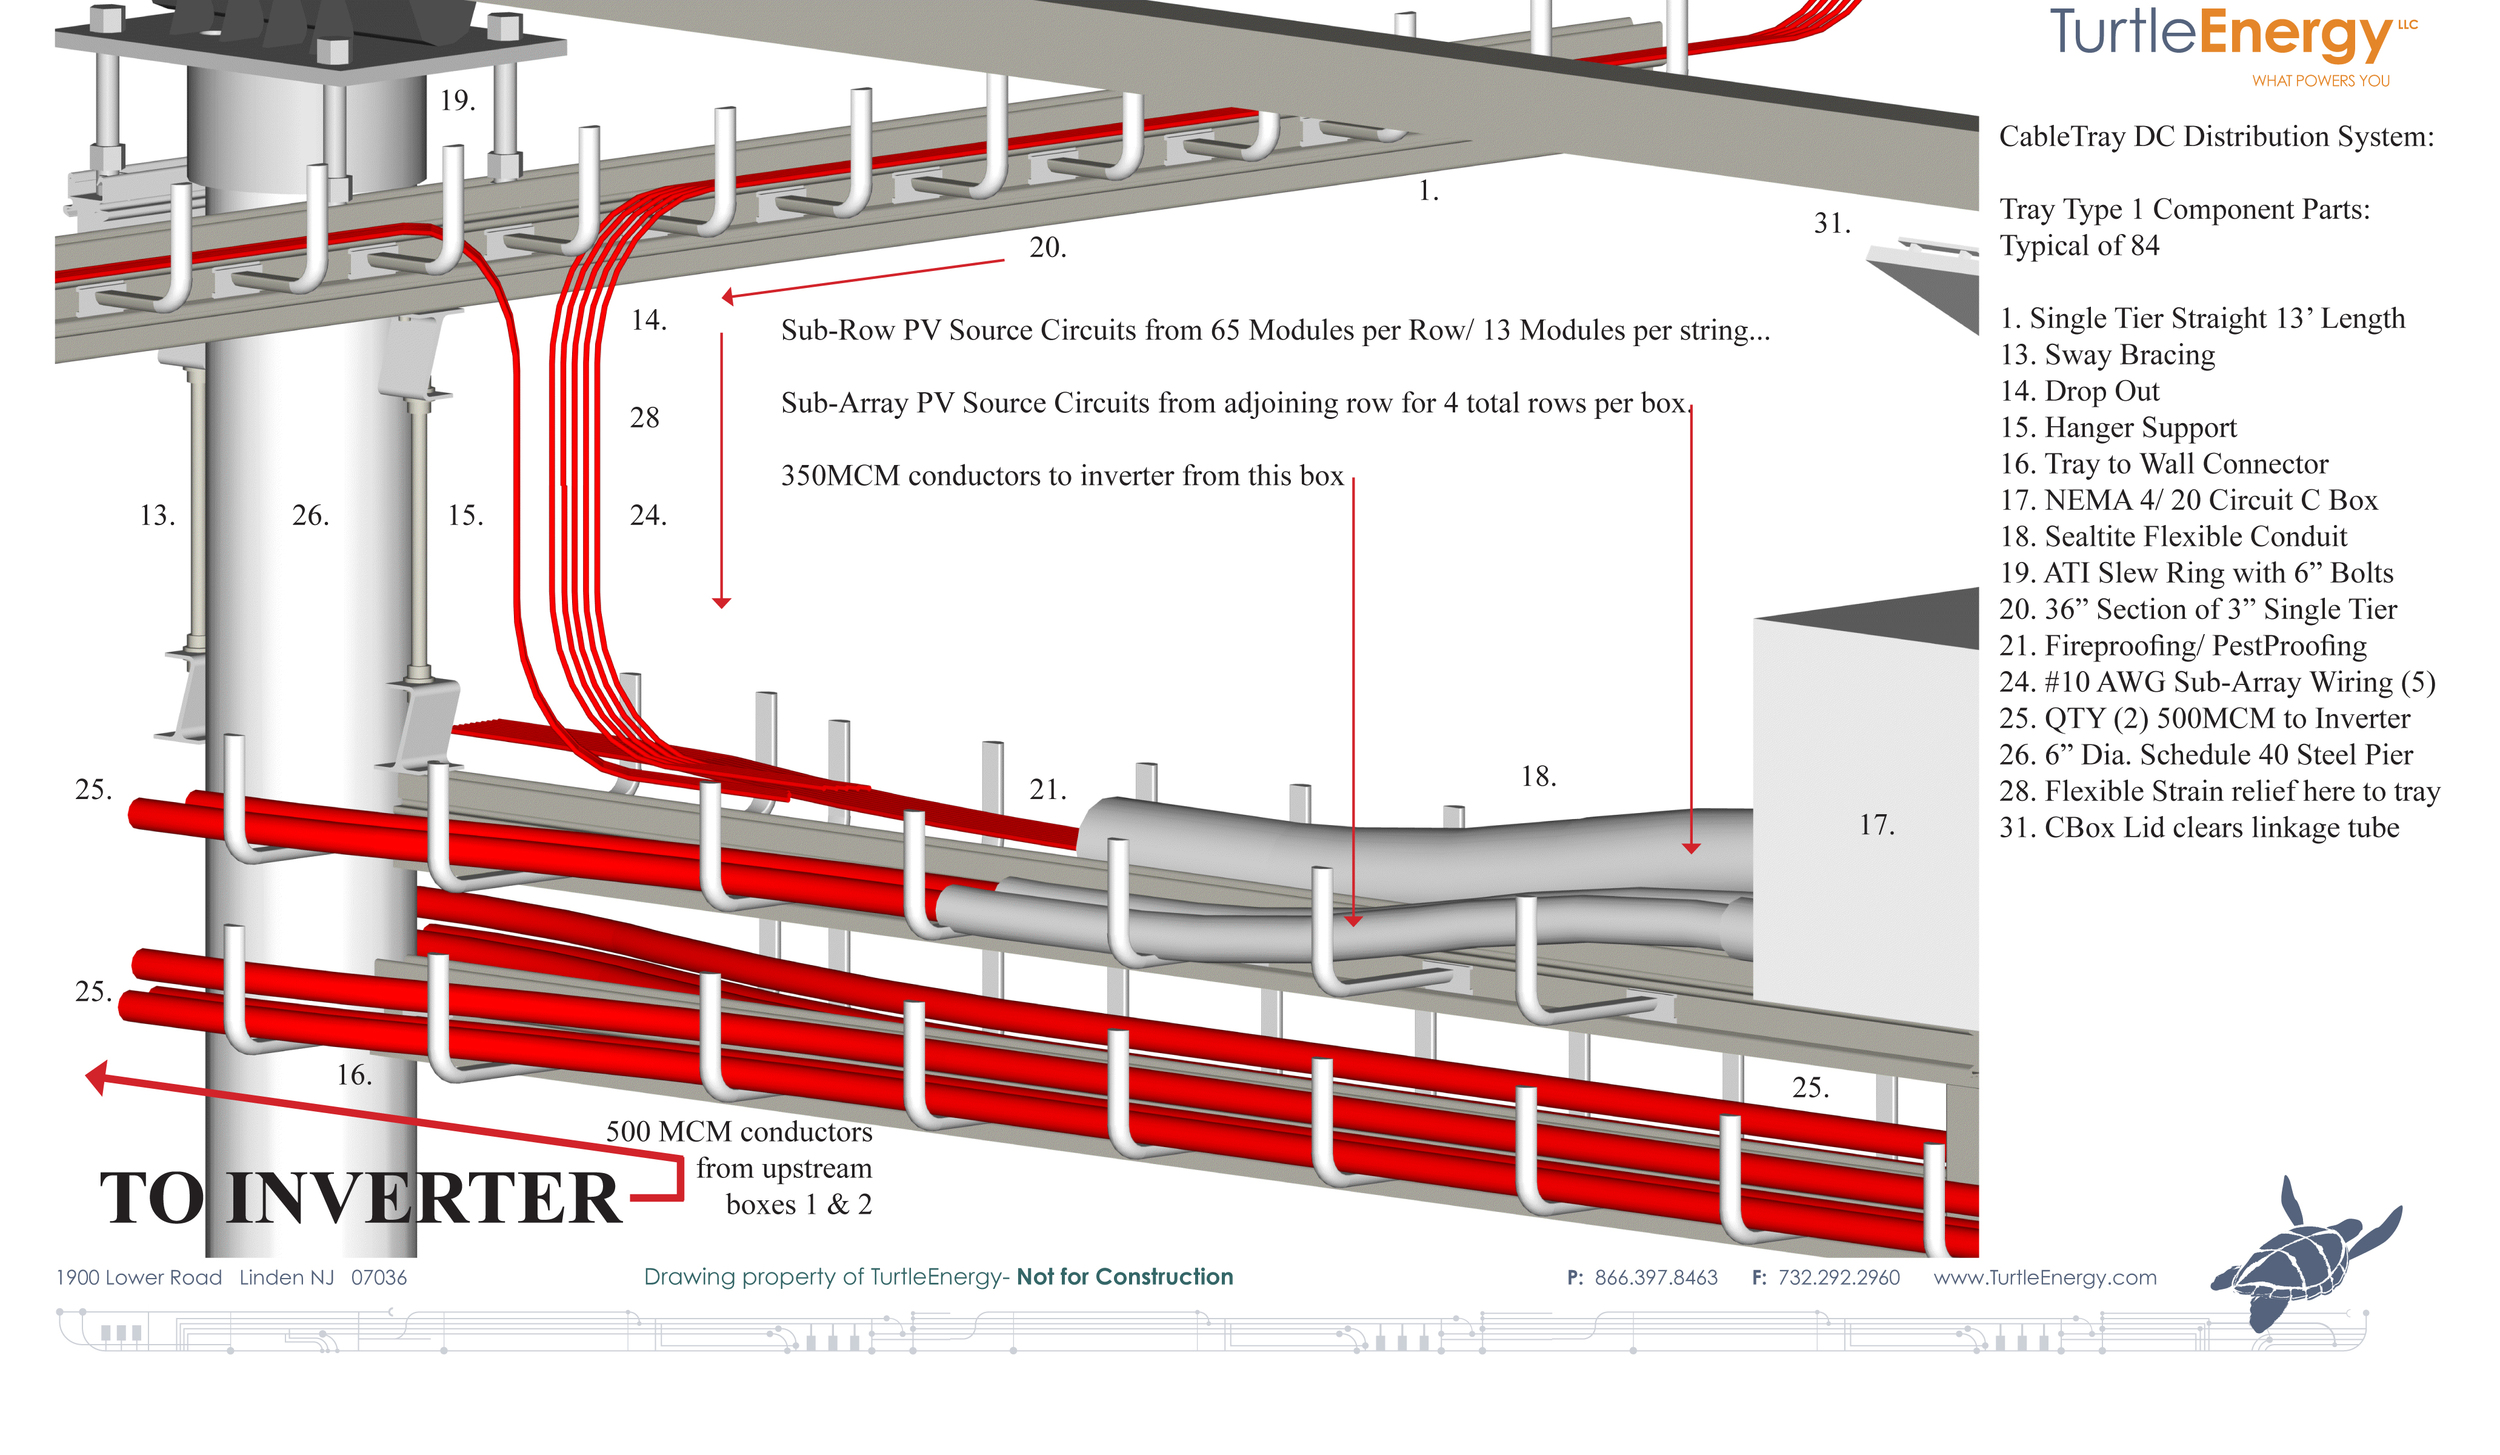
Figure 8: Orange lines indicate DC Electrical Distribution from solar modules to inverters.
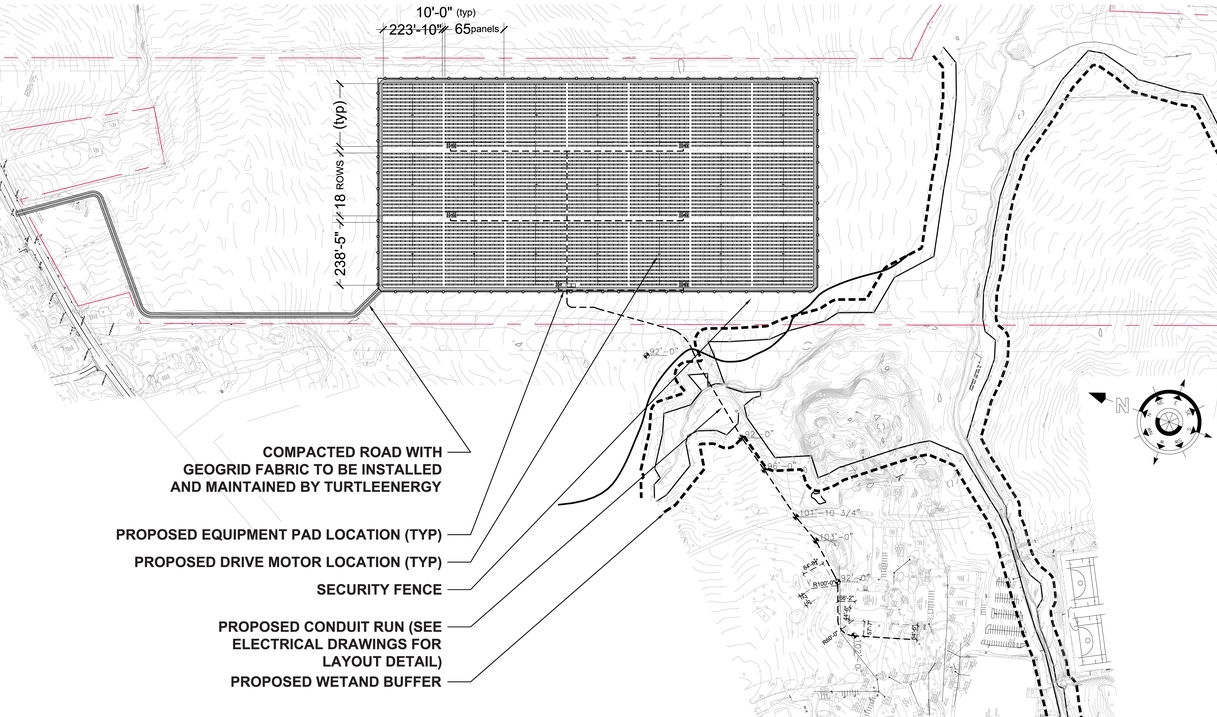
Figure 7: Exact definition of the route required to underground the electrical connection from the sun farm to the point of common coupling.
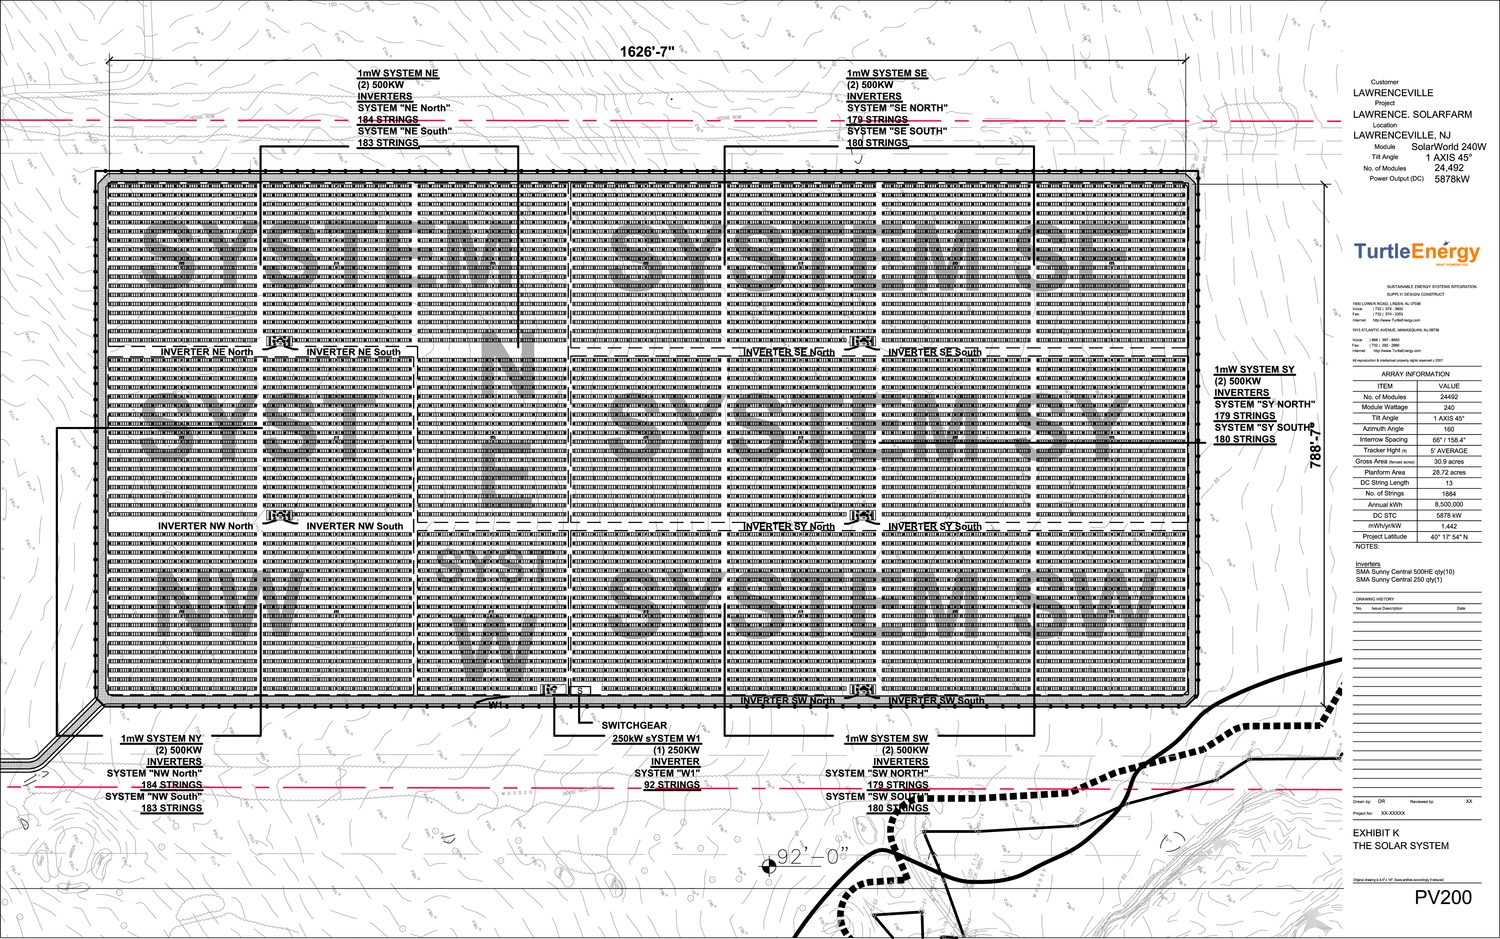
Figure 8: Schematic Electrical Plan showing system configurations (inverter to module group)
