50 kW Solar Project for New Jersey Institute of Technology Campus Center- Design Development
Project Data
End-User:
Installer:
Location:
Date of install:
Size of system in kW:
Energy produced since installation
Special Challenges Met:
Project Brief
Architecture Firm: Gwathmey Siegel Architects
Client: New Jersey Institute of Technology
Date of Construction Completion: Sept. 2005
John Millard's Role: Client Contact, Contractor Contact, Engineering Contact, Overall System Designer, Construction Administrator, Installation Trainer, Logistics of PV System Supply, Construction Finance Provider and Commissioning/ Monitoring Supervisor.
Date of Design Effort Complete: Schematic Design- November 2004, Design Development- May 2005, Construction Documentation- Jul 2005
Introduction to Photovoltaics
Photovoltaic systems are given strict guidelines by the National Electrical Code like any other type of electricity g enerating system.
Photovoltaic system voltage may range from hand held calculator voltage to over 1200 Volts Direct Current with DC current ranging from 1amp to over 800amps.
PV power output ranges from a few watts to several megawatts. PV systems can cause personal harm and property damage and must be installed with great duty of care.
Differences between PV systems and conventional electricity from the National Grid:
PV systems have DC circuits which require special design & equipment. PV systems have dispersed energy sources which require special disconnects inorder to isolate them.
Energy flow in a PV System may be bi-directional.
Common Installation Problems
Insecure structral attachment of PV Arrays to Rooftops
Inadequate weather sealing for rooftop penetrations.
Unsafe wiring methods insufficient conductor ampacity and insulation type.
Lack of or improper placement or ratings of overcurrent protection and disconnect devices. Unsafe installation, improper use and maintenance of batteries.
Use of unlisted equipment or improper application of listed equipment.
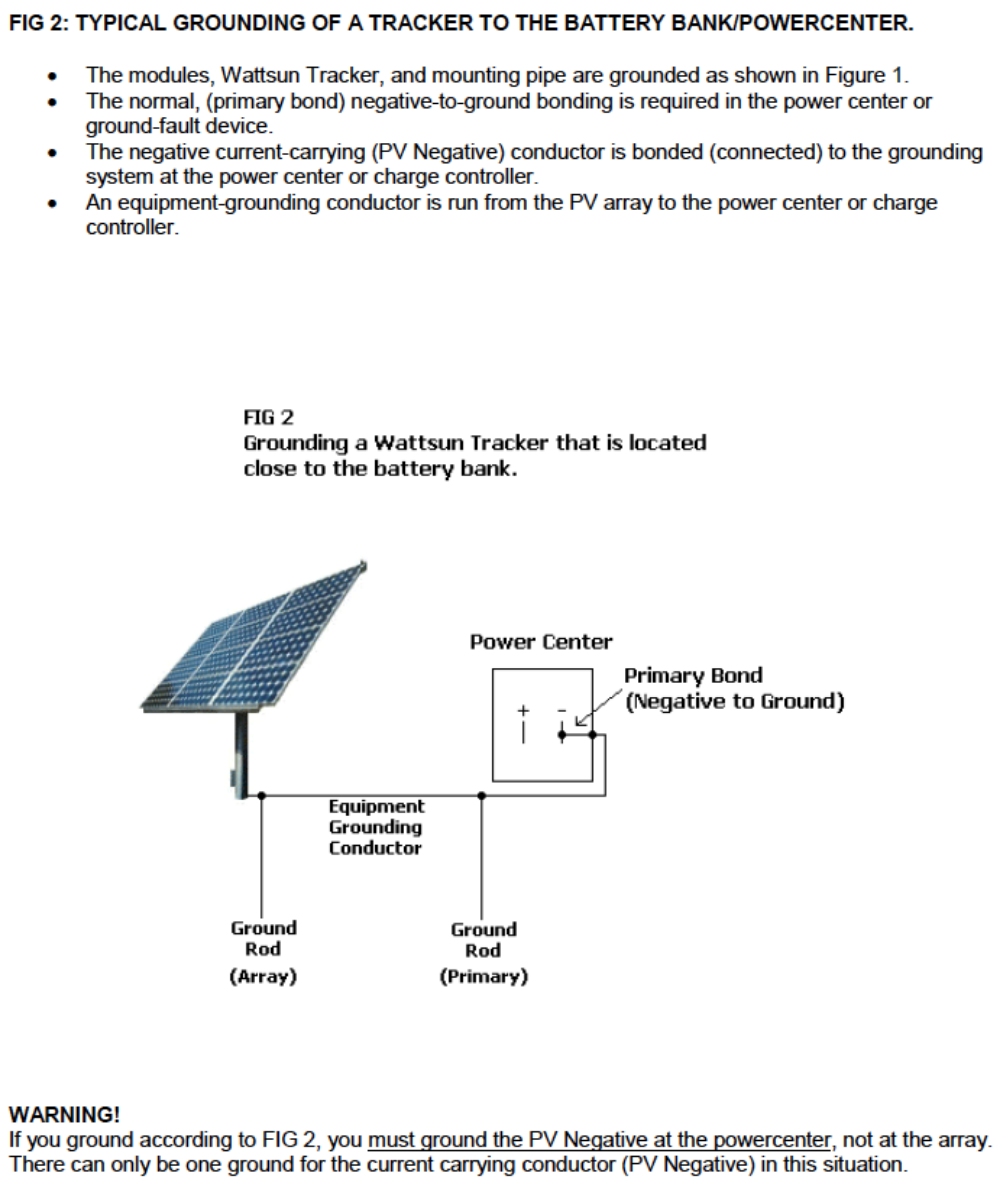
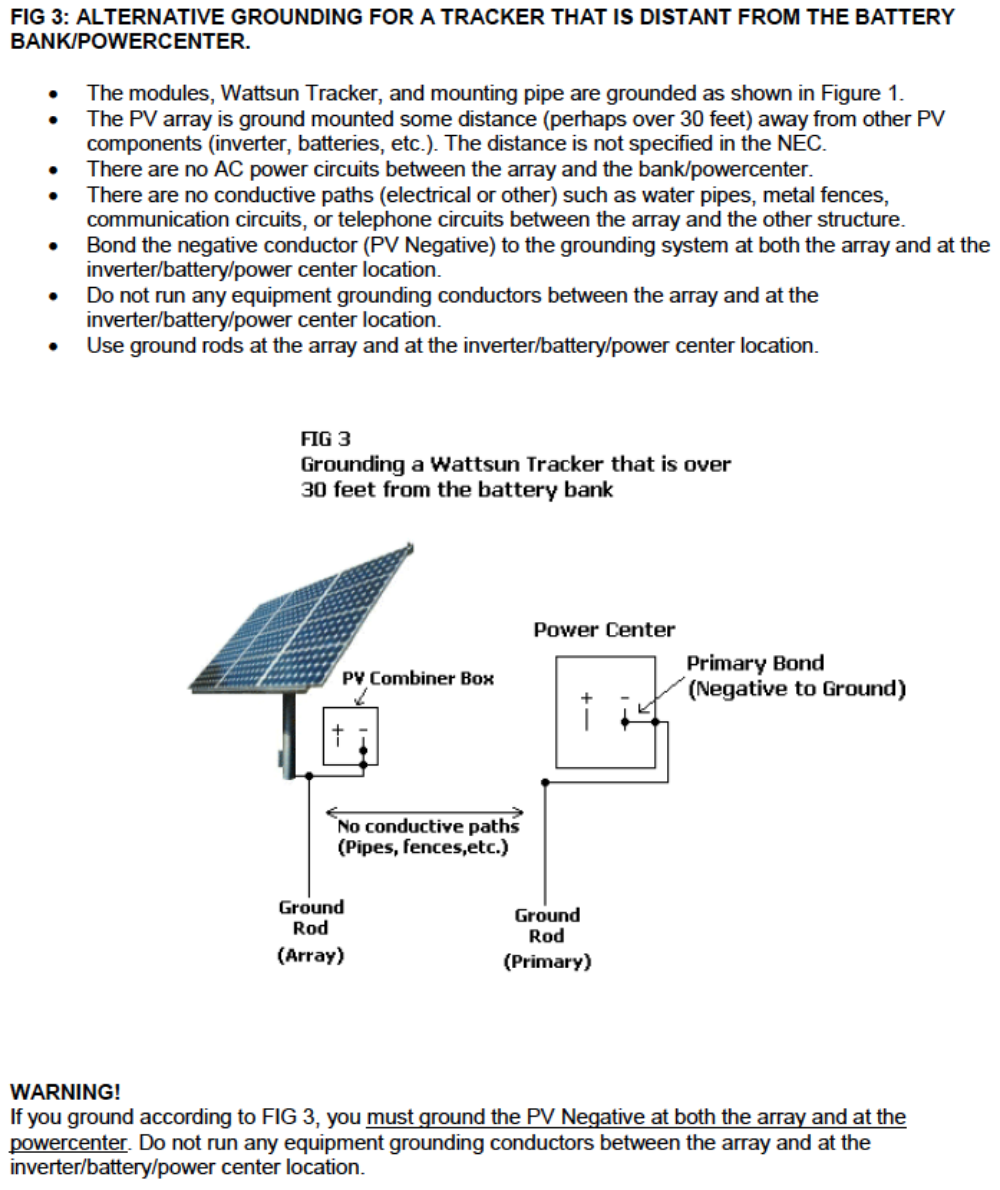
Lack of or improper system grounding.
Lack of or inadequate labling on major system components and disconnect devices.
Lack of or inadequate documentation on system design and operating and maintenance requirements.
A Brief History of Photovoltaics:
1839 Edmund Becquerel, the French experimental physicist, discovered the photovoltaic effect while experimenting with an electrolytic cell.
1904 Albert Einstein, in his first published scientific paper, explains the photovoltaic effect by describing light in terms of “Quanta” he called “photons”. This laid part of the foundation for Quantum Theory.
1921 Albert Einstein wins the Nobel Prize for his theory explaining photovoltaics. 1958 Vanguard I, the first PV-powered satellite, is launched.
1973 The Terrestrial solar industry is born at a conference in Cherry Hill, New Jersey.
2002 Worldwide production capacity for Photovoltaics surpasses 350 Megawatts per year, growing at a 20% per year pace. Grid connected PV grows at a rate of 100% per year.
2012 Worldwide production capacity for Photovoltaics surpasses 100 Gigawatts per year, an increase by 285X in one decade. By the end of 2013, worldwide installed photovoltaic capacity reached 139 gigawatts, close to 1 percent of the total electricity generation on the planet.[6] For 2014, another estimated 35 to 52 GW will be installed, and by 2018 the worldwide photovoltaic capacity is projected to have doubled (low scenario of 320 GW) or even tripled (high scenario of 430 GW) within five years.[1]
Current status
Europe: 81,488 MW (58.7%)
APAC: 21,992 MW (15.8%)
China: 18,600 MW (13.4%)
Americas: 13,727 MW (9.9%)
MEA: 953 MW (0.7%)
RoW: 2,098 MW (1.5%)
Worldwide
In 2013, another 38,400 MW of PV installations have been deployed. This is a new all time record in the history of worldwide PV growth and about 8,400 MW more than was deployed in the year before. The cumulated photovoltaic capacity increased by 38 percent to a running total of 139 GW. This is sufficient to generate at least 160 terawatt hours (TWh) of electricity every year[1] and about 0.85 percent of the electricity demand on the planet.[6]
Regions
Europe added 11 gigawatt of new PV installation in 2013. It is still the most developed region with a cumulated total of 81.5 GW, about 59 percent of the worldwide installed capacity. Solar PV now covers 3 percent of the electricity demand and 6 percent of the peak electricity demand. However, European PV deployment has slowed down by half compared to the record year of 2011, and will most likely continue to decrease. This is mainly due to the strong decline of new installations in Germany and Italy.
Countries
In 2013, photovoltaics grew fastest in China (+11.8 GW), followed by Japan (+6.9 GW) and the United States (+4.75 GW), while Germany remains the world's largest overall producer of photovoltaic power with a total capacity of 35.5 GW, contributing almost 6% to its national electricity demands. By now, Italy meets 7.8% of its electricity demands with photovoltaic power, thus making it the leader in that respect.
For the top ten leading countries in terms of deployed and overall PV-capacity see chart below. Other mentionable PV deployments in 2013, include France (613 MW), Canada (444 MW), Korea (442 MW), Thailand (317 MW), The Netherlands (305 MW), Switzerland (300 MW), Ukraine (290 MW),Austria (250 MW), Denmark (216 MW), Belgium (215 MW) and Spain (115 MW).
Elements of a Code Compliant PV System:
Sysem employs a well engineered design and quality components.
System and equipment are properly sized to meet expected or required performance.
Sysem uses listed, aproved and apropriately rated equipment with ultraviollet light resistant materials for outdoor application.
PV Array is mounted in an unshaded, accessible location with proper solar orientation, and if it uses roof penetrations, they shall be sealed with methods consistent with roofing industry practices.
All equipment is properly labeled and safety hazards identified.
Installation complies with all applicable building and electrical codes and accepted utility interconnection practice.
System is inspected and approved by utility and code officials, owners/operators are trained on safety and operation.
Characteristics of a Installer:
Possesses knowledge, skills and experience in working with electrical systems and PV Equipment.
Properly selects, sizes systems and equipment to meet performance expectations.
Applies for permits and utility interconnection approval.
Practices safe, clean and orderly work habits.
Employs accepted methods for the use and installation of PV Equipment and completes work in a timely, efficient manner. Completes inspections, commissioning, acceptance tests and transfer to owner/ operator.
Provides follow-up service as required.
Documents provided to each Installation:
Complete system and equipment specifications/ owner’s manual Electrical Schematics and mechanical drawings
Parts, materials and source lists.
Installation and checkout procedures.
Operation, troubleshooting and maintenance proceedures.
Inverters and Utility Interconnection for PV Systems
Inverter (690.2)-
Equipment that is used to change voltage level or waveform , or both, of electrical energy. Also known as a power processing unit (PCU), or power conversion system (PCS), and inverter is a device that changes dc input to ac output. Inverters may also function as battery chargers that use alternating current from another course and convert it into direct current for charging batteries.
Inverters for PV Systems are available in sizes from 100 watts to 1MW or more.
DC Operating voltages from 12 volts to 600 volts with AC outputs from 120V single phase to 480 volts 3Phase.
DC Operating voltages from 12 volts to 600 volts with AC outputs from 120V single phase to 480 volts 3Phase.
Different configurations for PhotoVoltaic Systems:
Stand alone Inverters- Inverter in any photovoltaic system which converts the wave form of electrical current and is independent of any electrical production and distribution network. Typically, stand alone inverters charge a battery bank.
Inverter Output Circuit Current:
The maximum current shall be the maximum output current rating. {(690.8) (A)(3)}
Stand-Alone Inverter Input Circuit Current: The maximumcurrent shall be the standalone continuous inverter input current rating when the inverter is producing rated power at the lowest input voltage. {(690.8) (A) (4)}
IE: The input current for a 5500 watt, 48-Volt that is 85% efficient at 44 volts can be calculated as follows:
Ampere Input= (5500 Watts) / (44Vdc x 0.85)= 147Adc
Size Inverter to supply expected continuous load demand. Sum all AC loads which may simultaneously operate from the inverter. Surge Ratings must be capable of starting motor loads such as pumps. Higher Power requirements usually dictate higher DC input voltages to reduce the size of wiring and overcurrent devices required for the inverter.
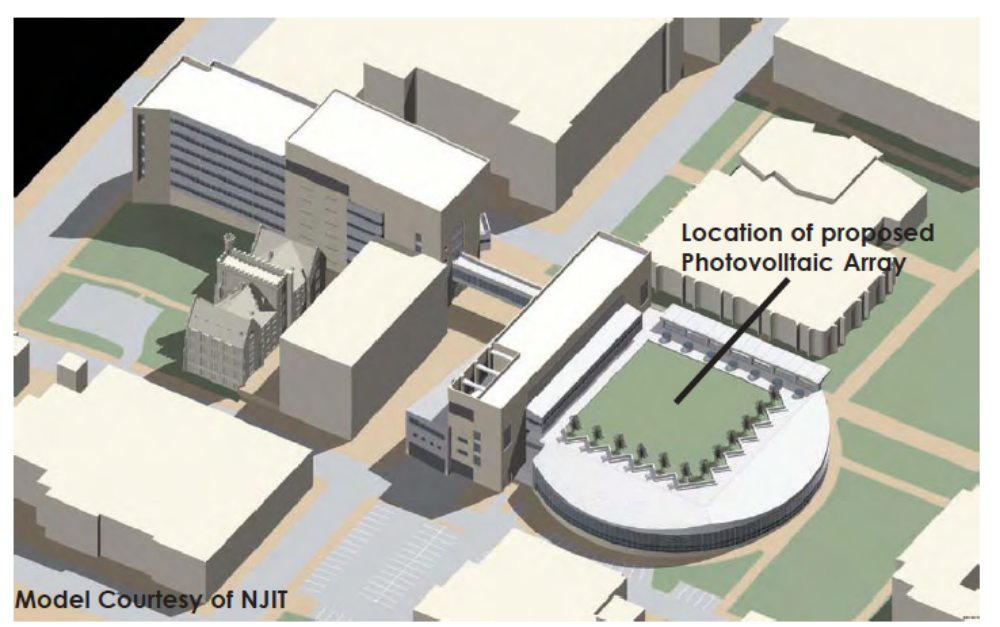
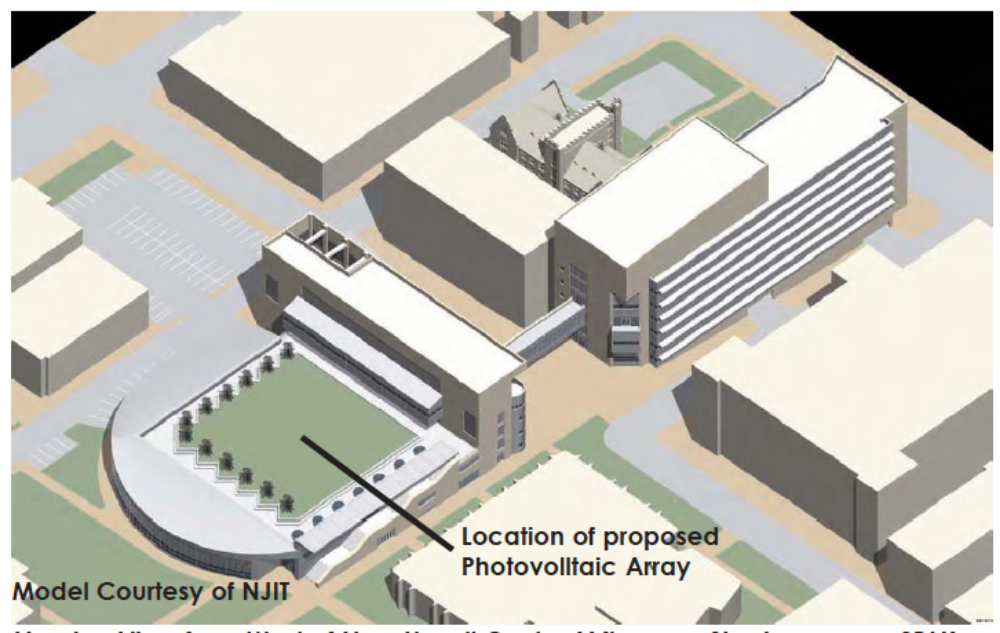
Massing View from North of New Hazell Center (Afternoon Shadow aprox. 2PM)
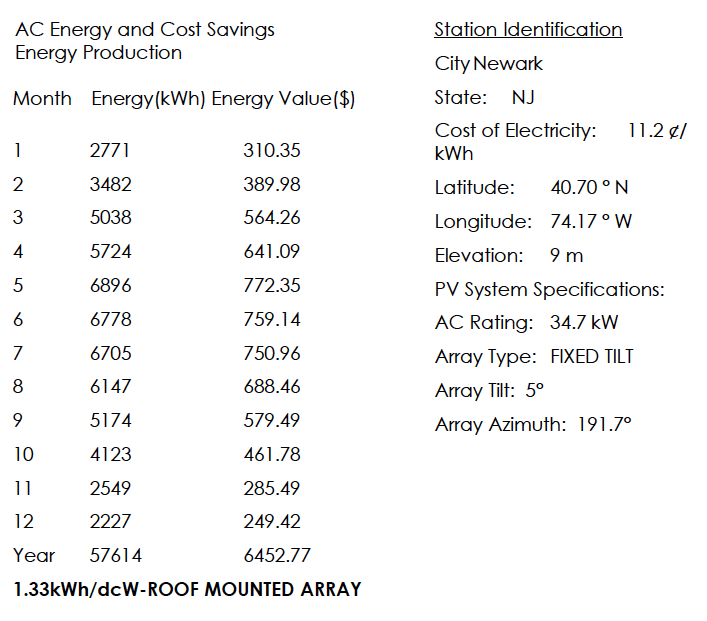
Projected: AC Energy and Cost Savings Energy Production (ROOF MOUNTED ARRAY)
Massing View from West of New Hazell Center (Afternoon Shadow aprox. 2PM)
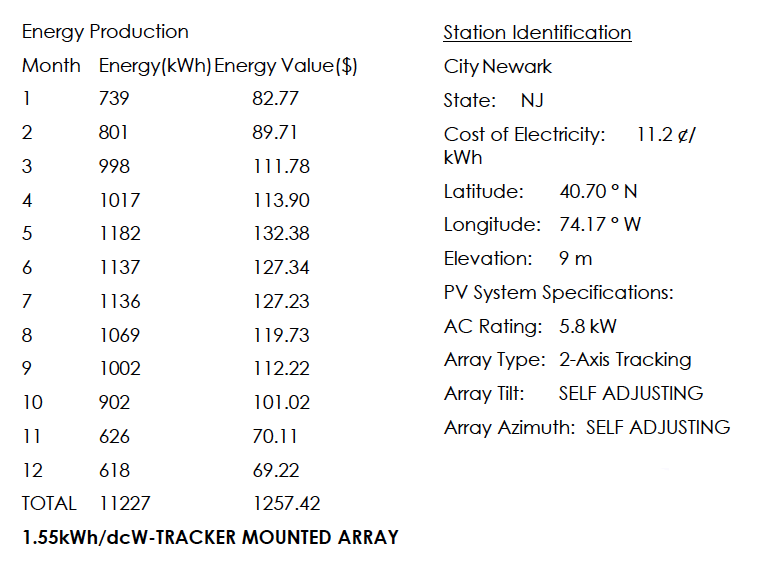
Projected AC Energy and Cost Savings Energy Production (TRACKER MOUNTED ARRAY)

Establishing magnetic north graphically...
Two reputable maps, a compass reading and a north arrow off of an architect’s drawing indicate that Magnetic North can reliably be traced off of a 15O the campus grid...this is the consensus direction of north which will be accepted by this study for the purpose of locating the sun in the sky.
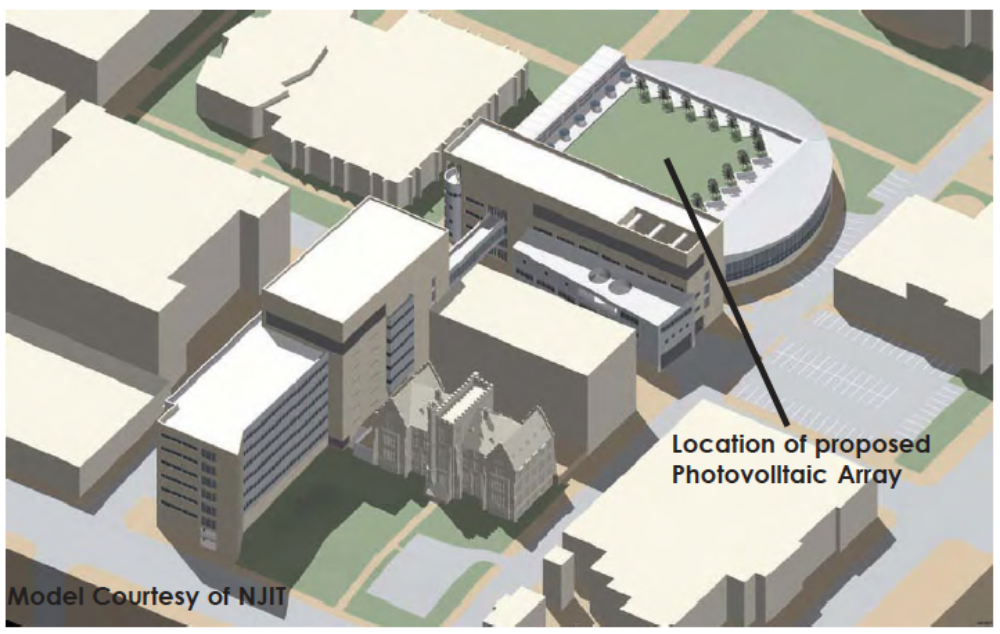
Massing View from East of New Hazell Center (Afternoon Shadow aprox. 2PM)
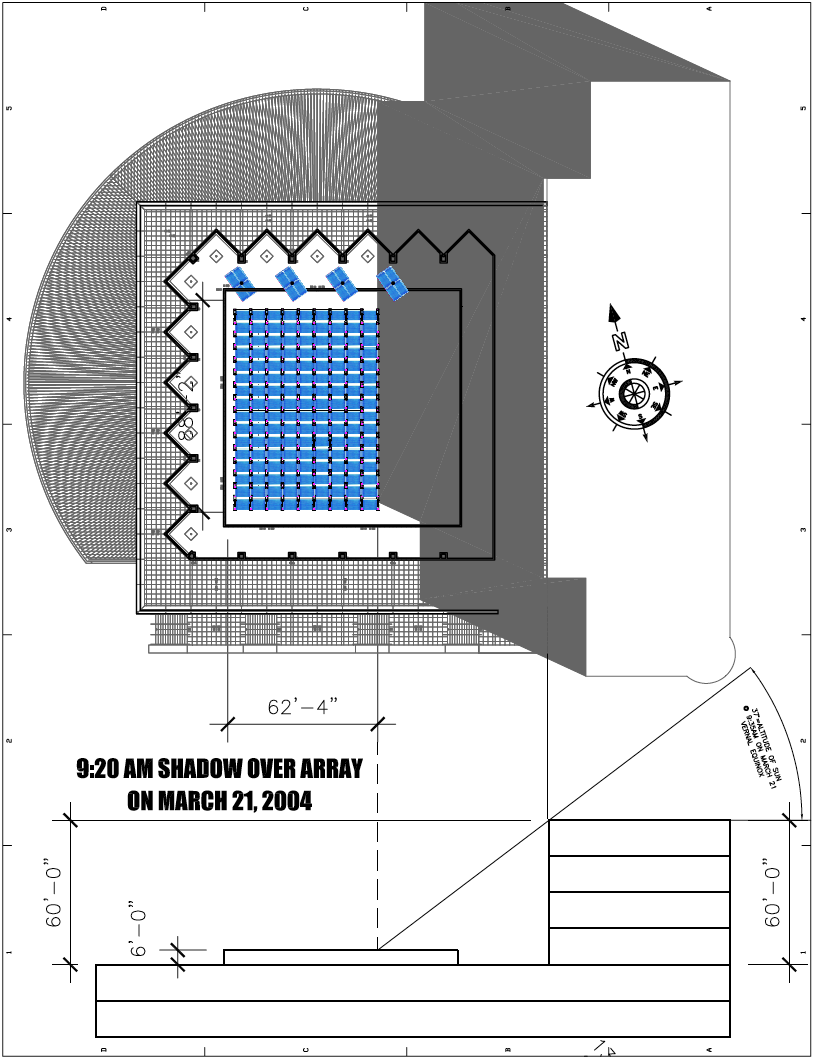
Calculating the impact of the adjoining building shading upon electricity production.
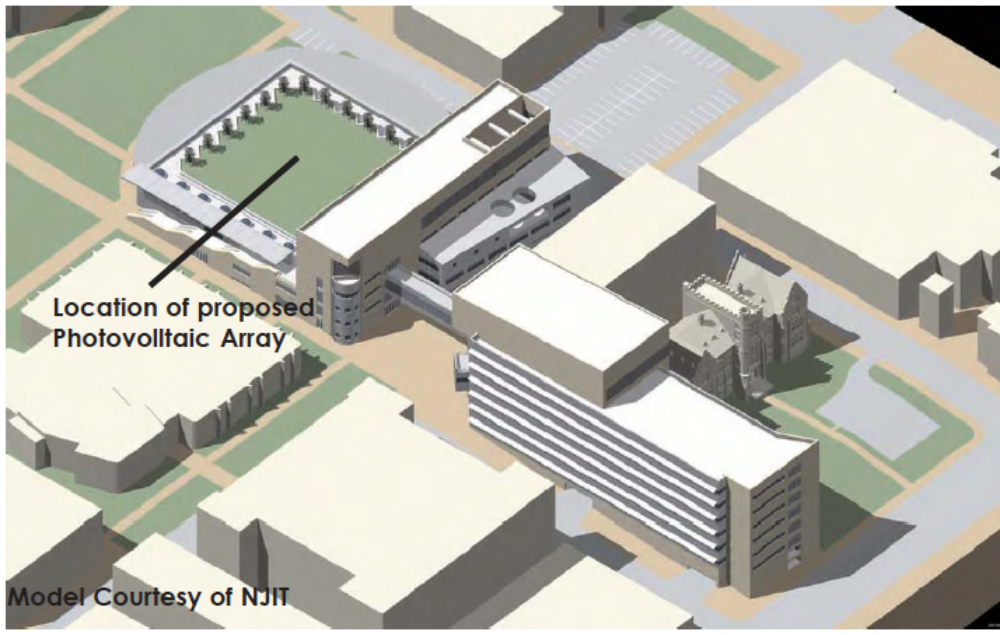
Massing View from South of New Hazell Center (Afternoon Shadow aprox. 2PM)
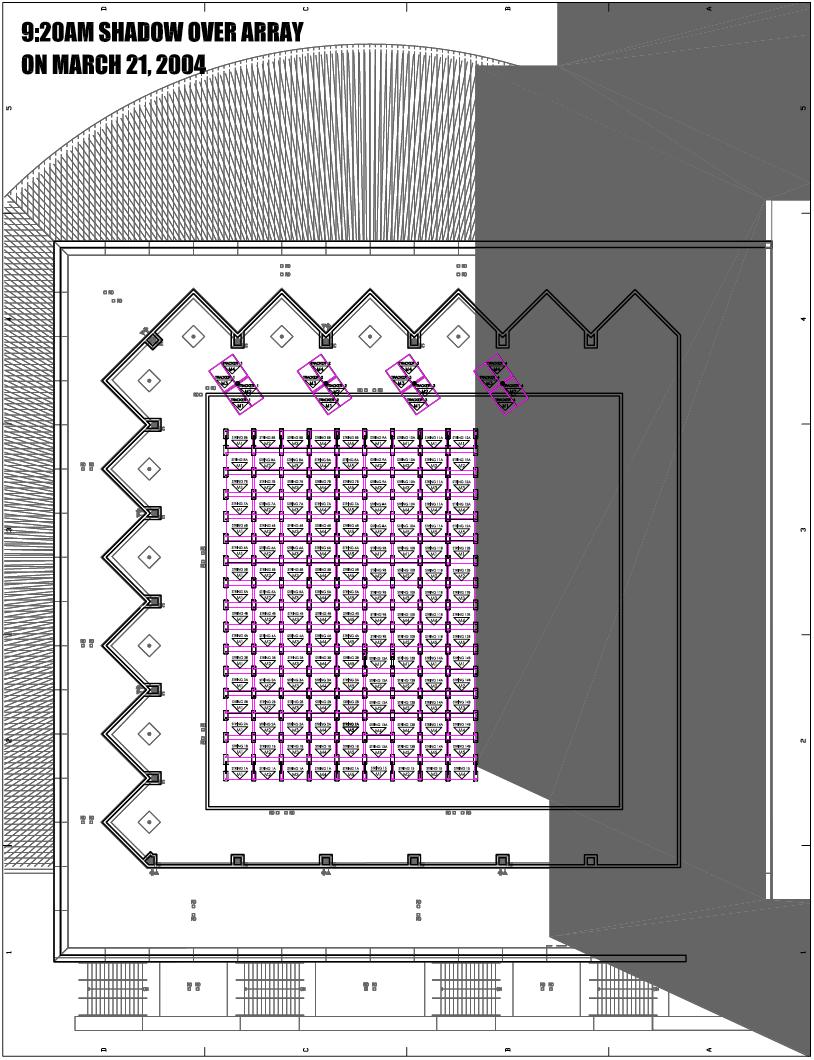
Module layout showing string configuration.
The adjoining building morning shadow clears the array at 9:20am on an average solar day (autumnal equinox). Strings on the west side of that array are wired to create parallel strings to the shadow line so that entire strings would energize each respective inverter as the sun moved across it prio to 9:20am.
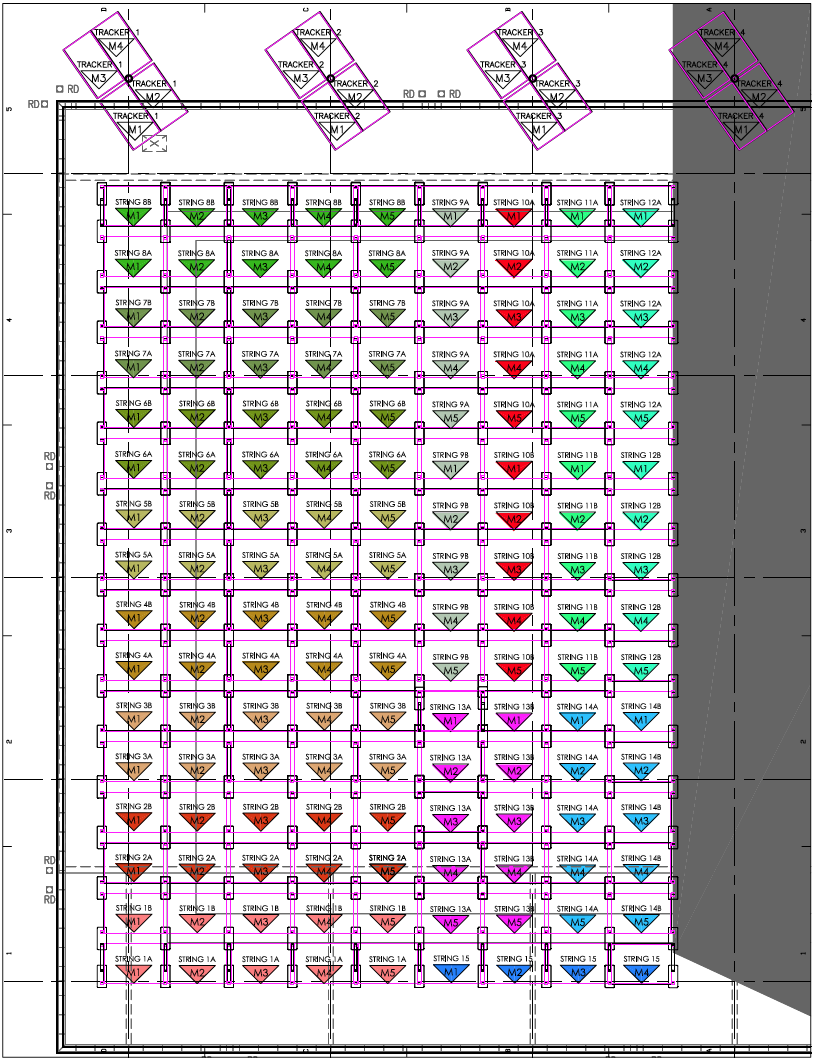
Enlarged module layout showing string configurations.
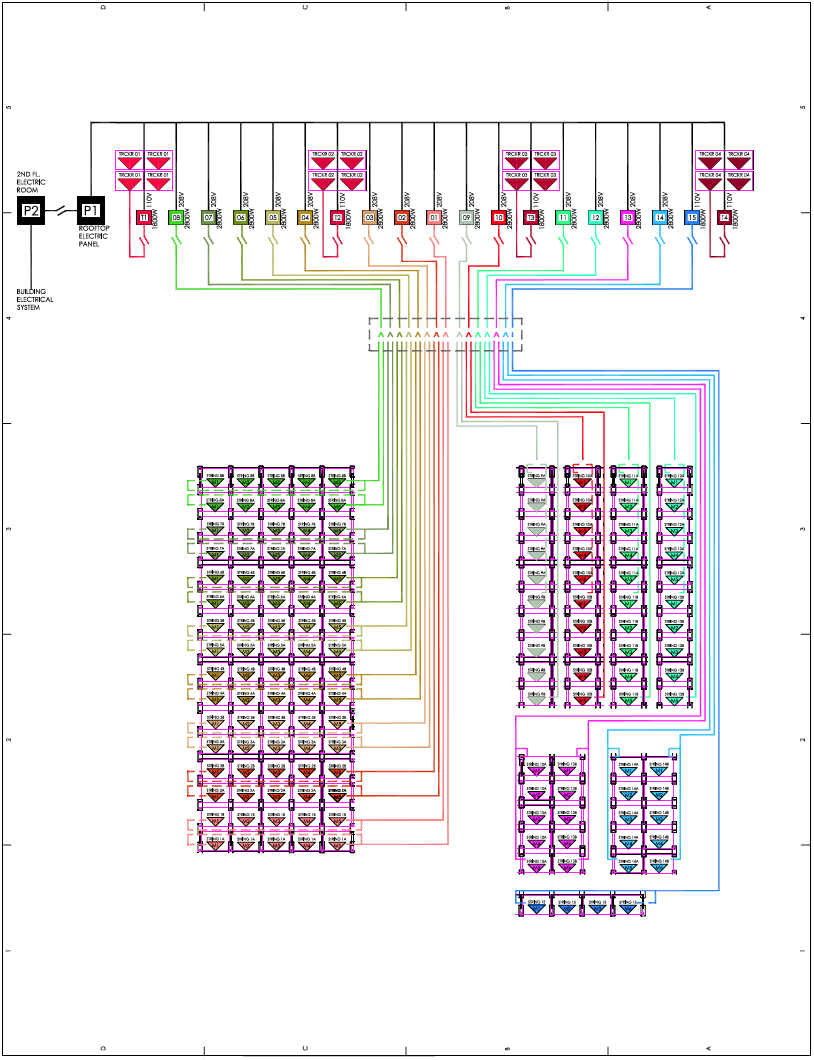
Color coded circuitry diagram shows no. of modules per string and inverter relationship.
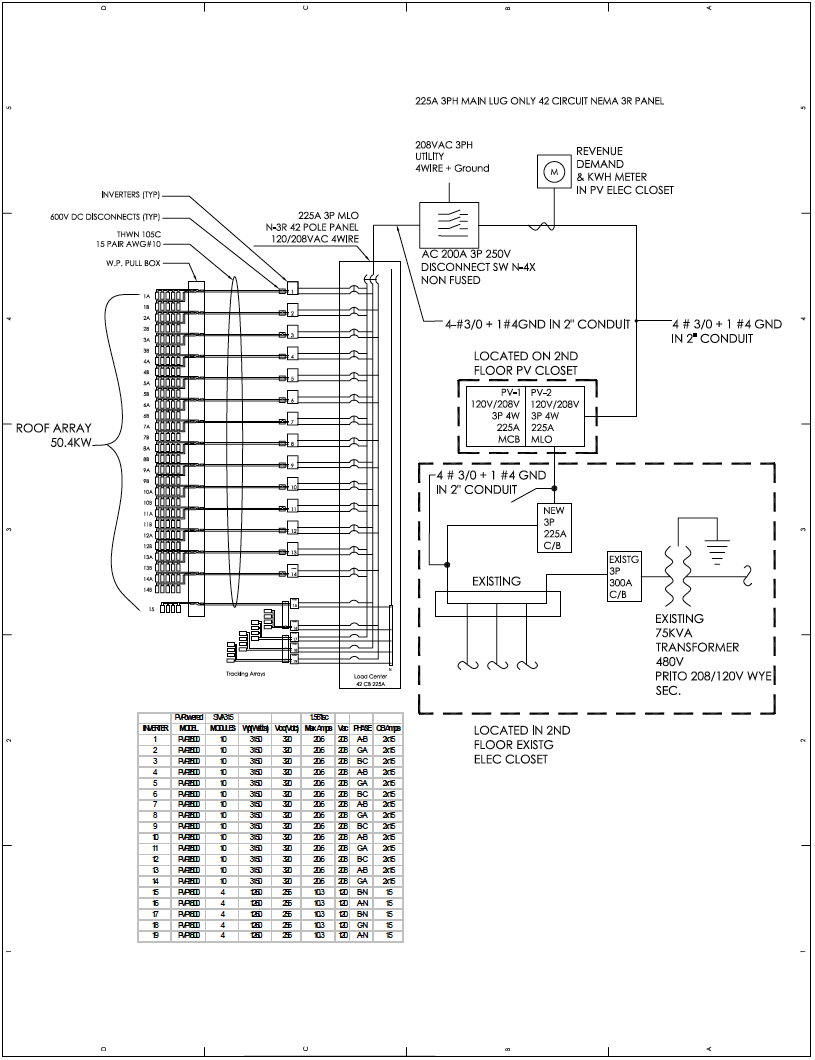
Electrical Single Line Diagram by TurtleEnergy EE Richard Lenskold.
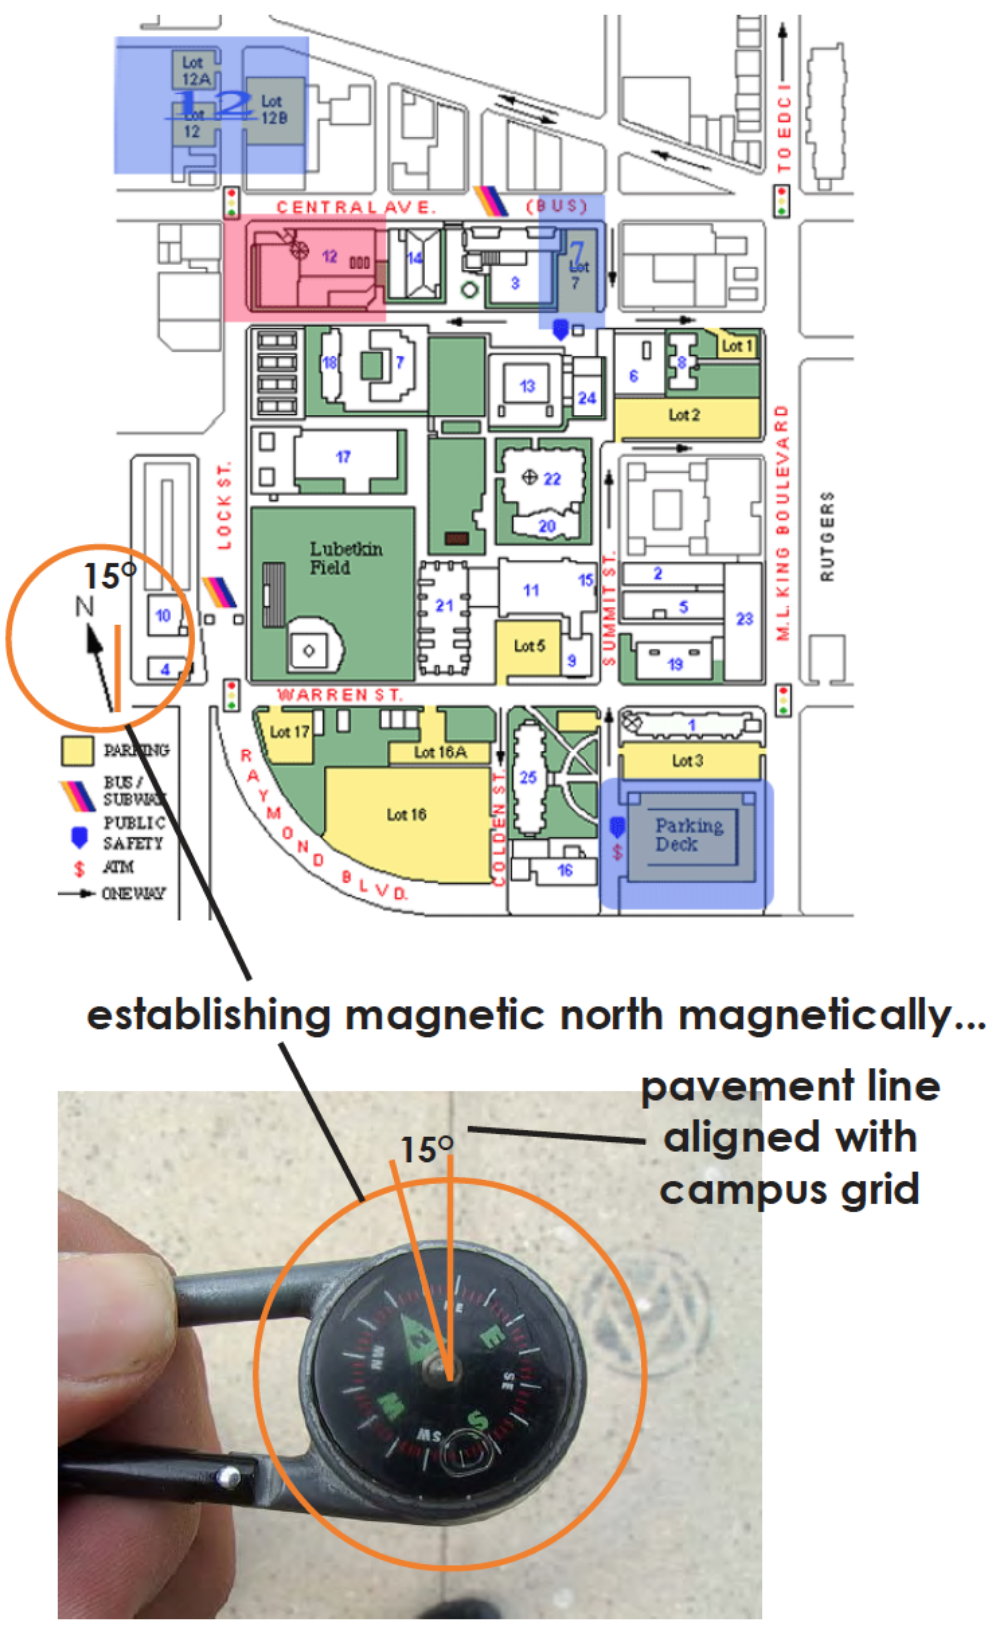
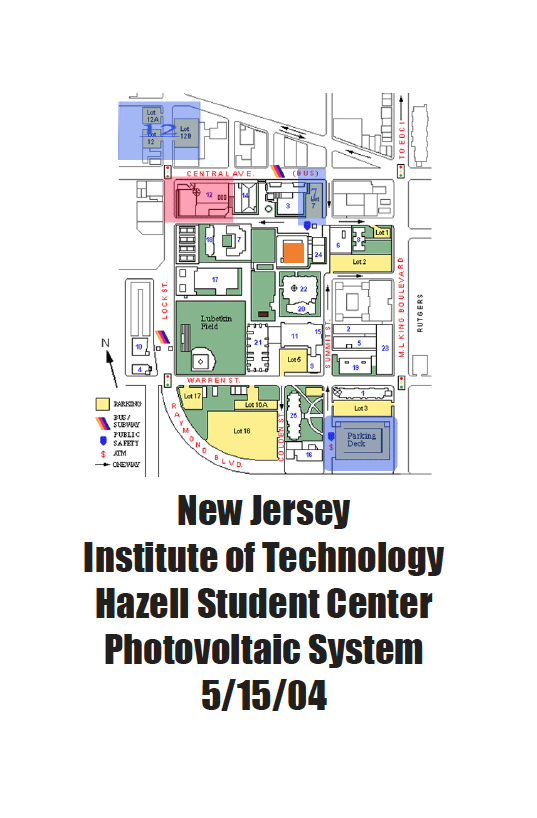
Campus Map showing deviation of the campus grid from Magnetic North.
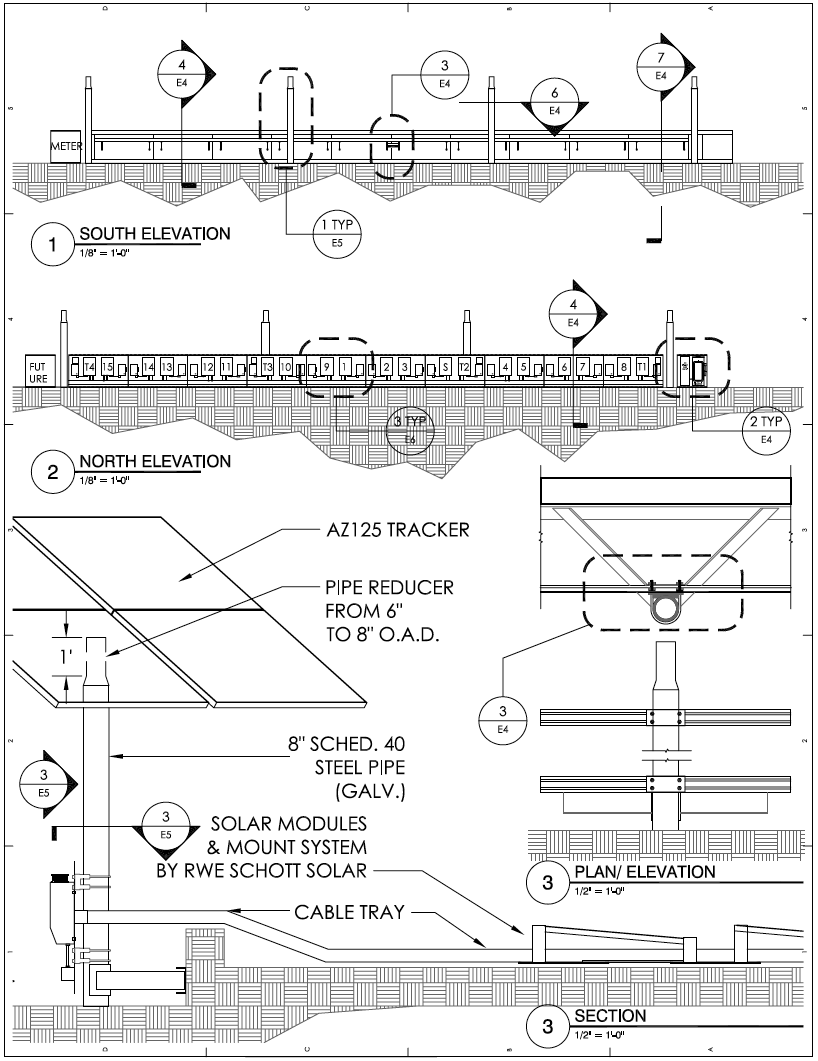
Strut Scaffold support for PV Inverters, DC Disconnects, Power & Communications Cable Management
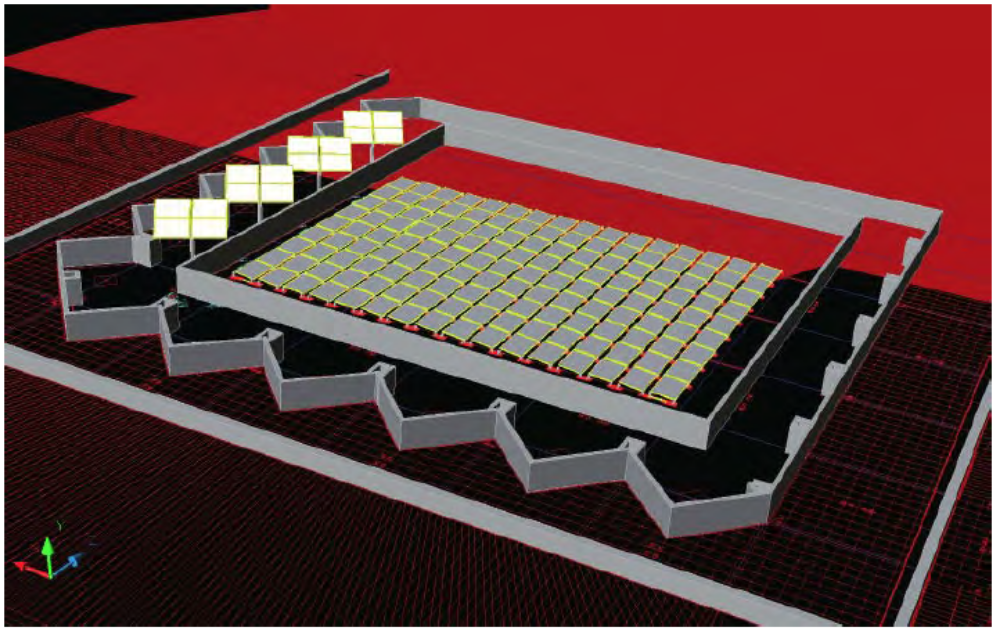
Schematic Visualization of NJIT Solar Project showing the segregation of roof mounted modules tilted at 5 degrees and tracker mounted modules mounted dynamically.
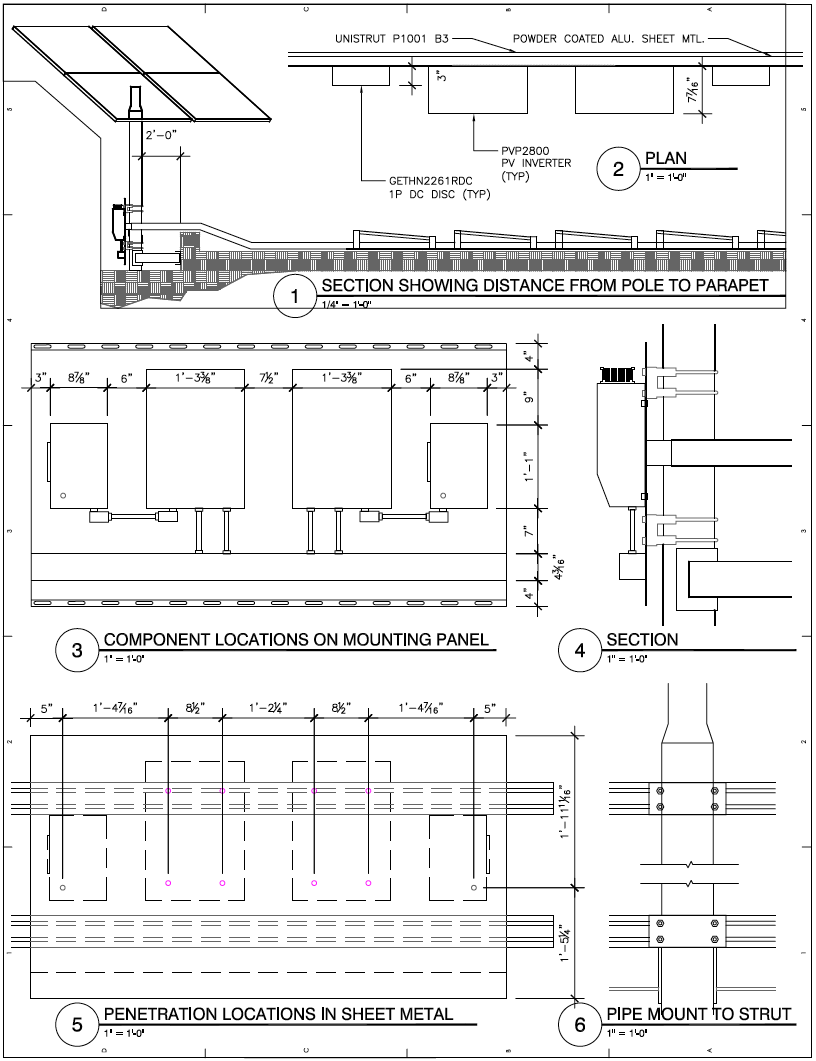
Strut Scaffold support for PV Inverters, DC Disconnects, Power & Communications Cable Management
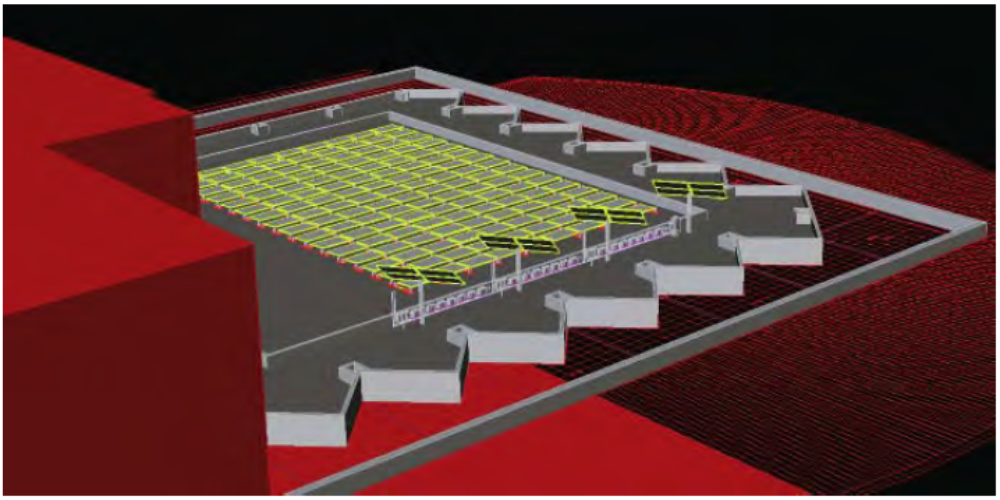
Schematic Visualization of NJIT Solar Project showing the segregation of roof mounted modules tilted at 5 degrees and tracker mounted modules mounted dynamically.
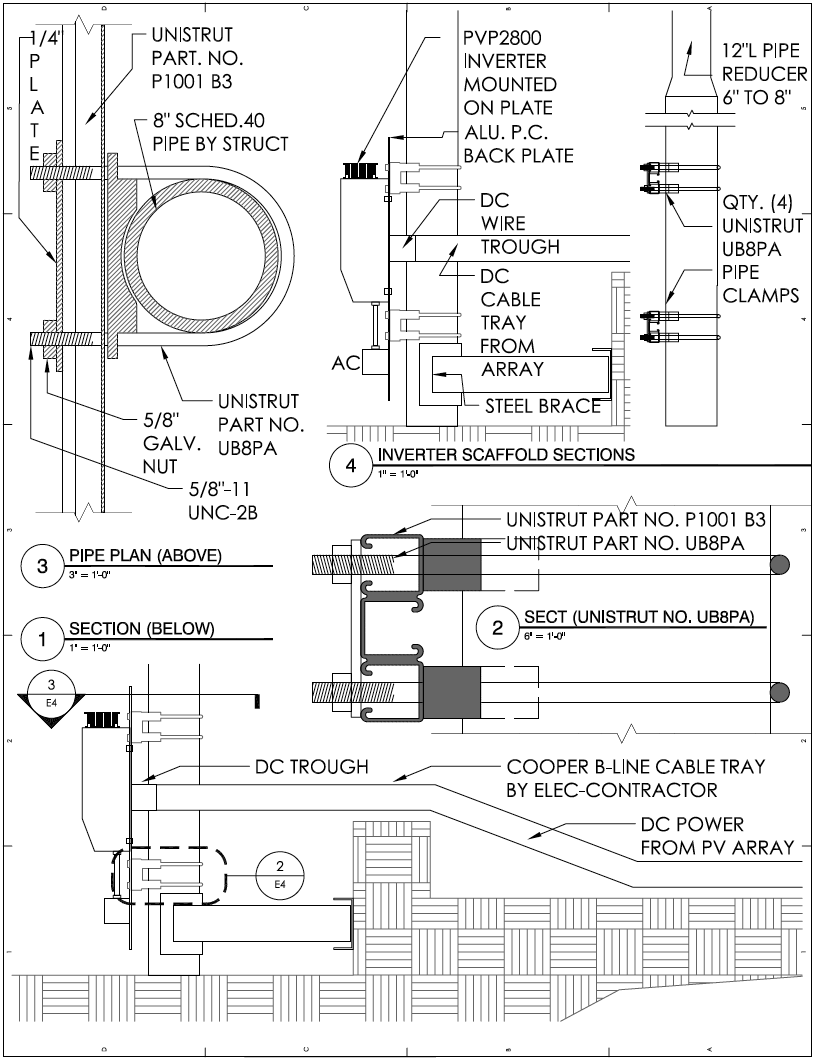
Strut Scaffold support for PV Inverters, DC Disconnects, Power & Communications Cable Management

Schematic Visualization of NJIT Solar Project showing the segregation of roof mounted modules tilted at 5 degrees and tracker mounted modules mounted dynamically.


Schematic Visualization of NJIT Solar Project showing the segregation of roof mounted modules and tracker mounted modules with inverter scaffold shown spanning between tracker piers.
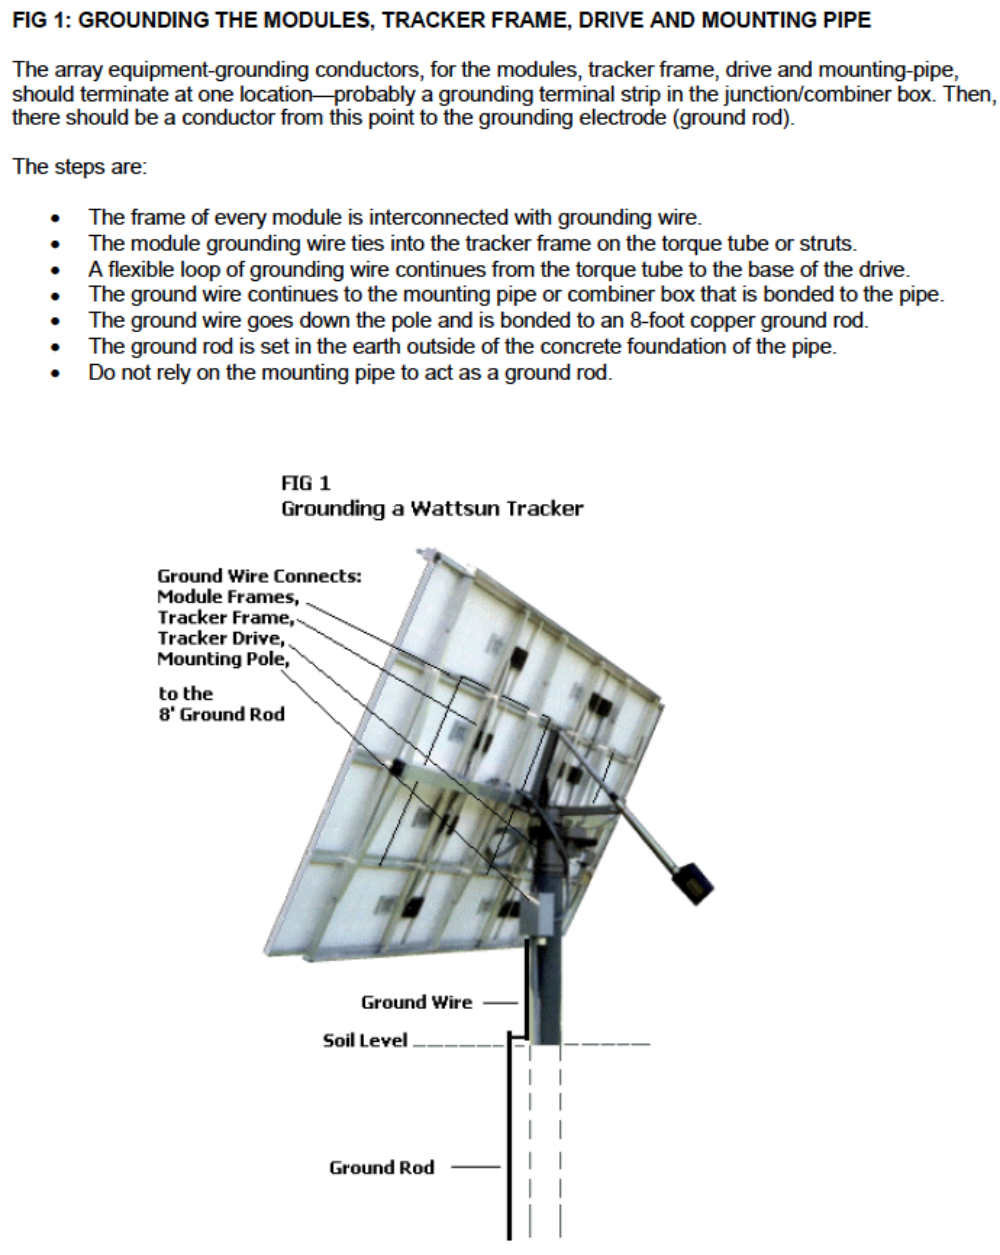

Schematic Visualization of NJIT Solar Project showing the segregation of roof mounted modules tilted at 5 degrees and tracker mounted modules mounted dynamically.

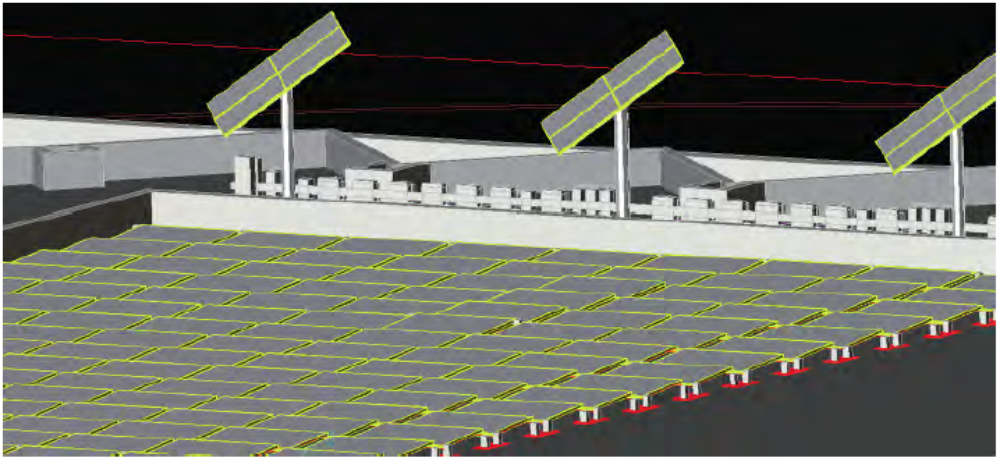
Schematic Visualization of NJIT Solar Project showing the segregation of roof mounted modules tilted at 5 degrees and tracker mounted modules mounted dynamically.
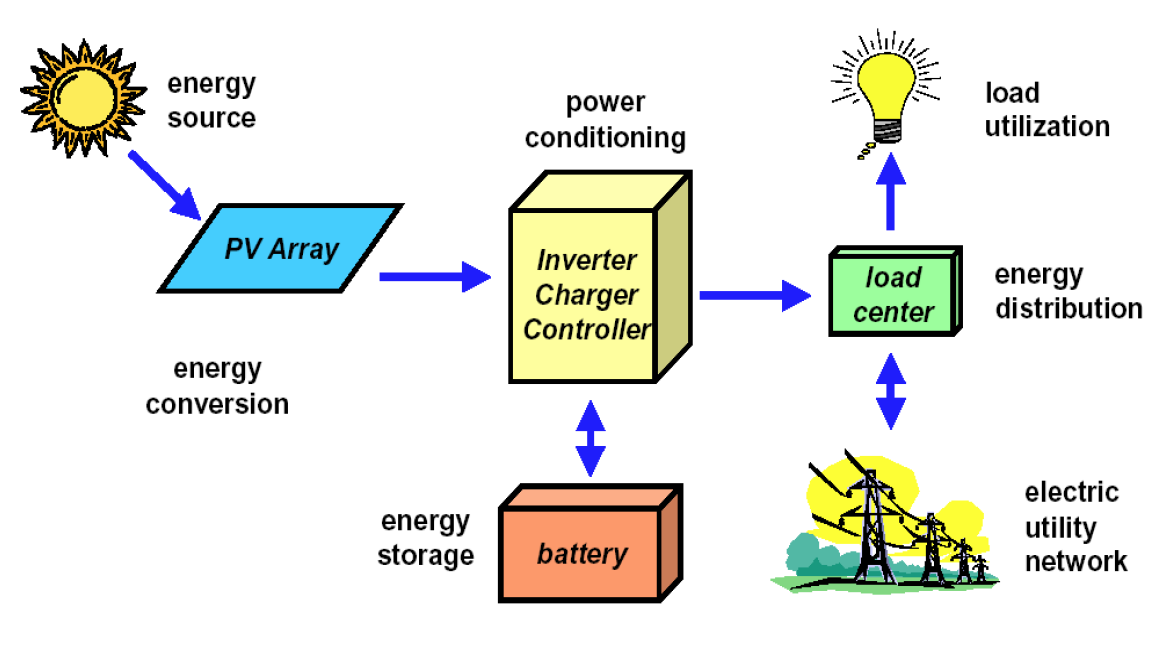
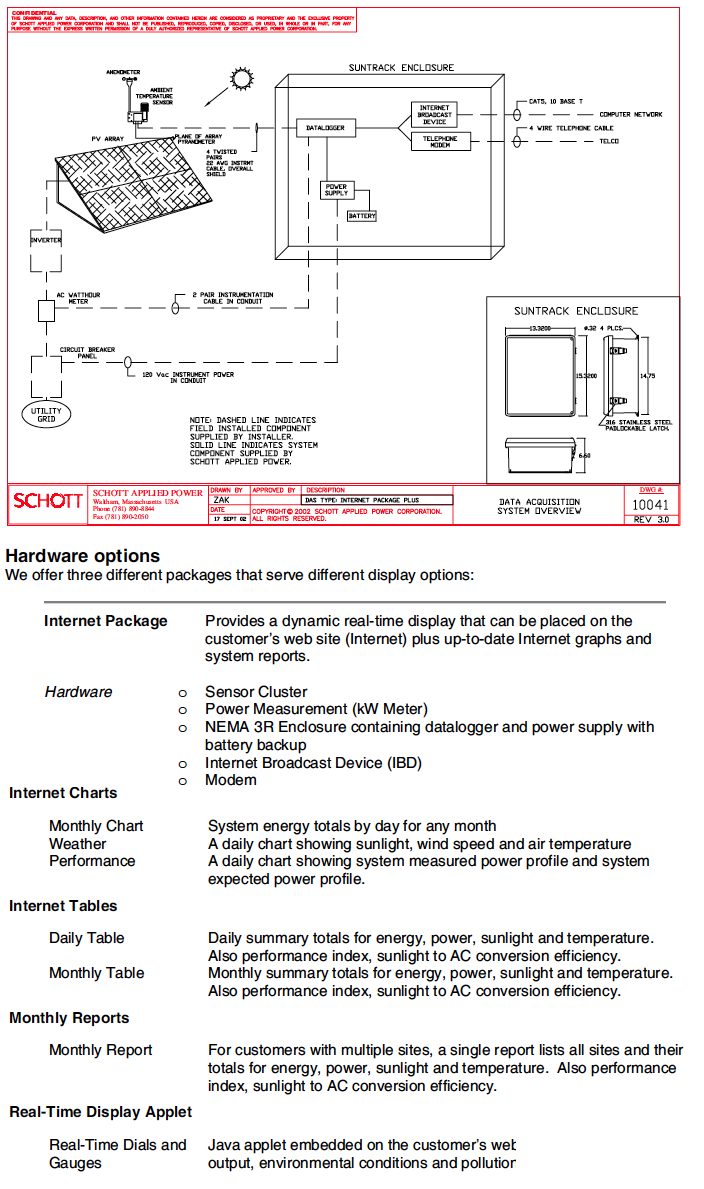
Figure 1: Diagram showing relationship of photovoltaic array to the other components of an electrical system.
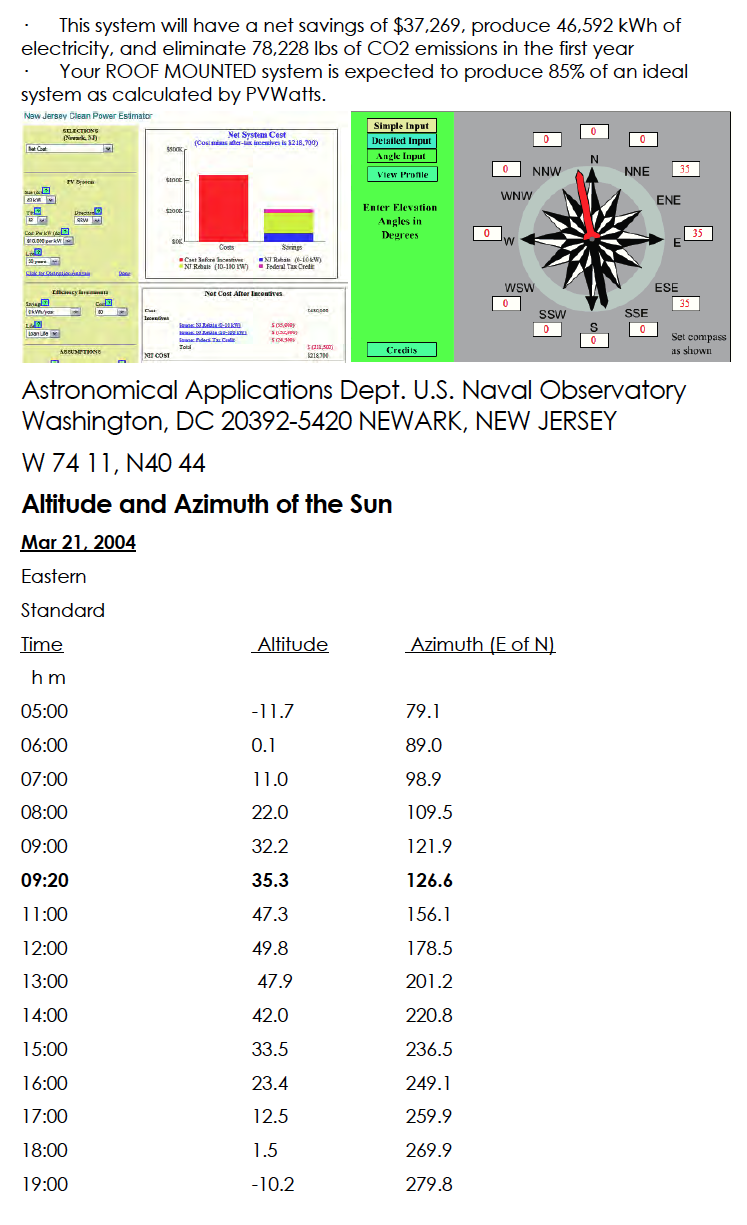
Altitude and Azimuth of the Sun was calculated in order to quantify the impact of adjoining building shadows.
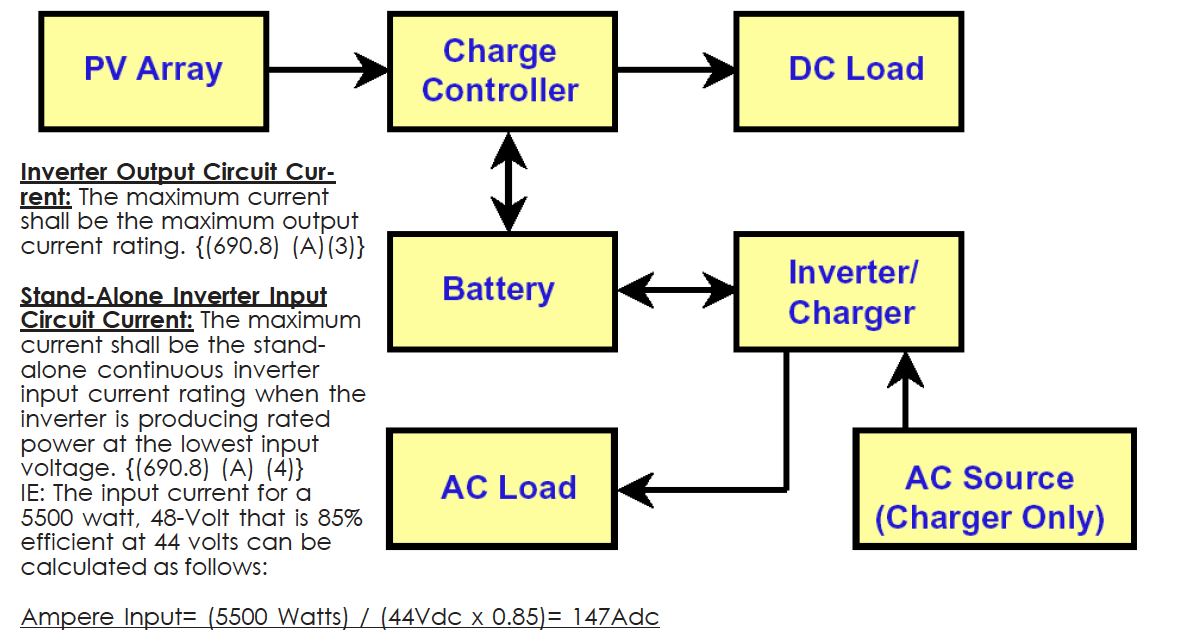
Figure 2: Diagram showing Stand-Alone Inverter (arrows indicate direction of electricity flow)
Different configurations for PhotoVoltaic Systems: Stand Alone Inverters- Inverter in any photovoltaic system which converts the wave form of electrical current and is independent of any electrical production and distribution network. Typically, stand alone inverters charge a battery bank.
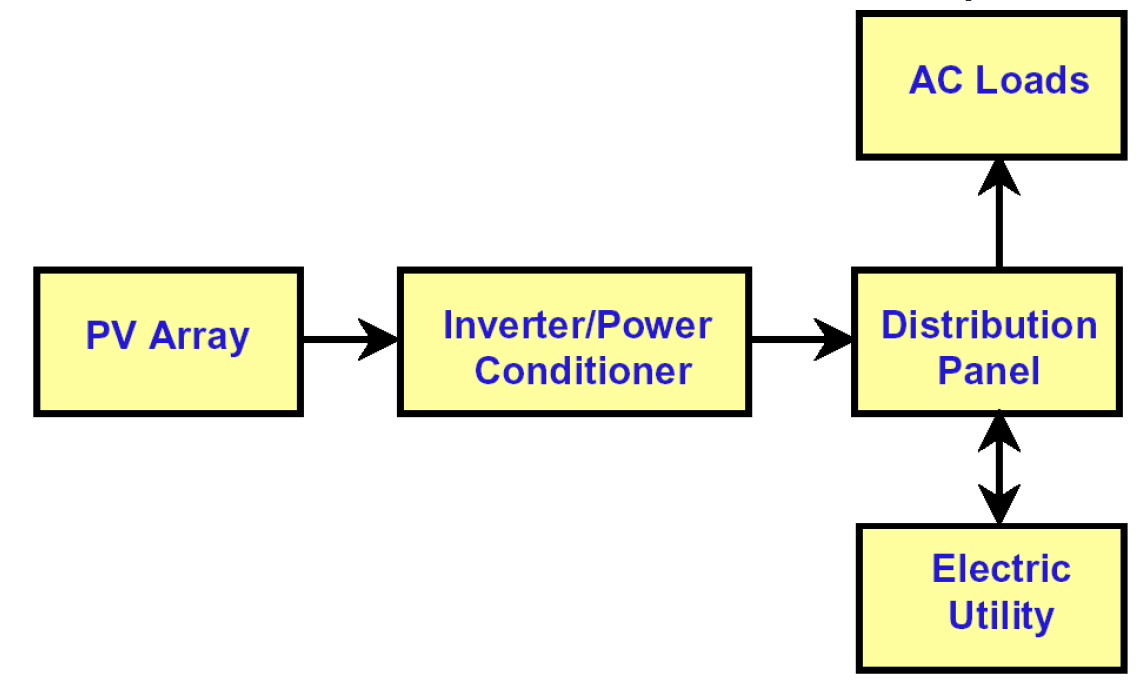
Figure 2: Diagram showing Utility Interactive Inverter
Utility interactive or Grid Connected Inverters- Inverters in solar PV systems that operate in parallel with and may deliver power to an electrical production and distribution network. Utility interactive inverters are capable of charging a battery bank.
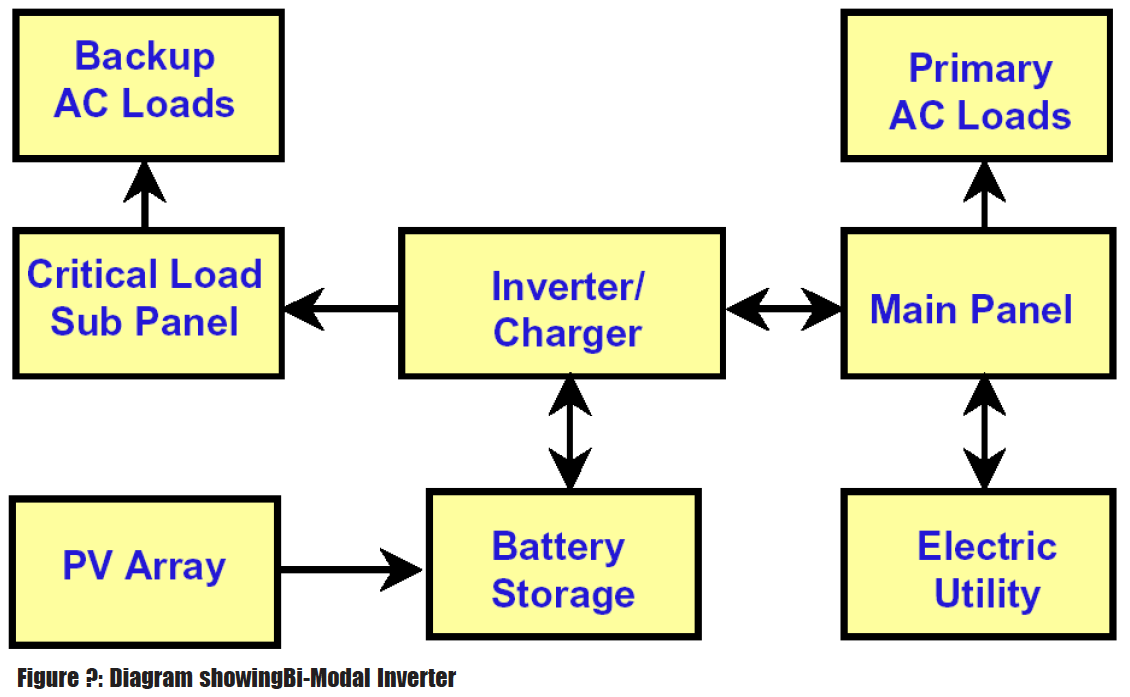
Figure 4: Diagram showing Bi-Modal Inverter
Bi-Modal Inverters can operate either in interactive or stand-alone mode, but not simultaneously and typically charge batteries.

Figure 5: Diagram showing distinguishing characteristics of different wave forms used in power processing units.
Different wave forms found in various inverters-
Square Wave-
an alternating current wave form that switches between positive and negative values every half period.
simple square wave inverters often hav difficulty starting induction motors, have high harmonic distortion and poor surge capacity.
generally not suited for motors or other inductive loads.
Quasi Sine Wave-
a wave form aproximating a true sine wave, having lower harmonic distortion than a square wave.
Many inverters used inearly stand-alone photvoltaic systems were quasi sine wave. Sine Waven the purest of alternating current wave forms, characteristic of power generated by the electric utilities and generators (rotating machinery).
State of the art inverters used in PV systems have sine wave output with low harmonic distortion.
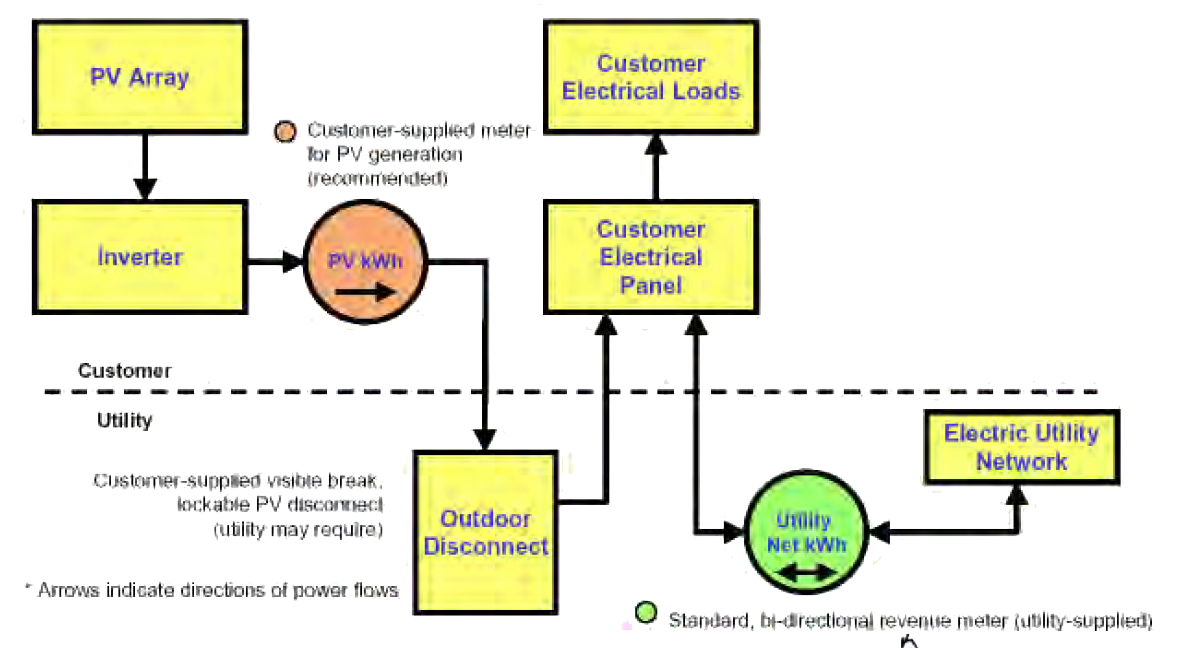
Utility Interactive PV - No Storage-Net Metering.
PV System works in Parallel and synchronously with the utility grid
PV System supplements on site energy usage, electrical loads are supplied either by the PV System or by the utility, depending on the amount of PV Generation and magnitude of the load.
Single Net Utility Revenue meter credits customer full retail value for excess energy supplied back to the grid.
Some utilities require an accessible, outdoor disconnect for the PV System.
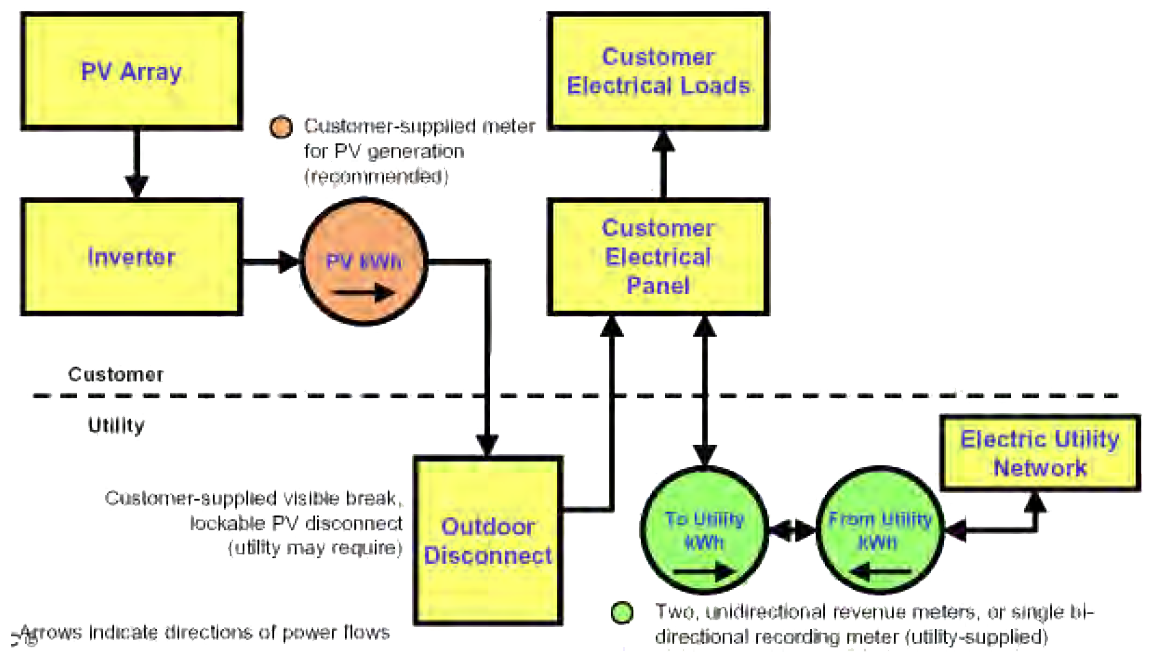
Utility Interactive PV System Dual Metering
Two utility revenue meters are required (or a single bidirectional recording meter).
One meter records energy delivered to the facility, for which the customer pays retail value.
Second meter records energy delivered to the utility grid, for which the customer is credited wholesale value of the electricity.
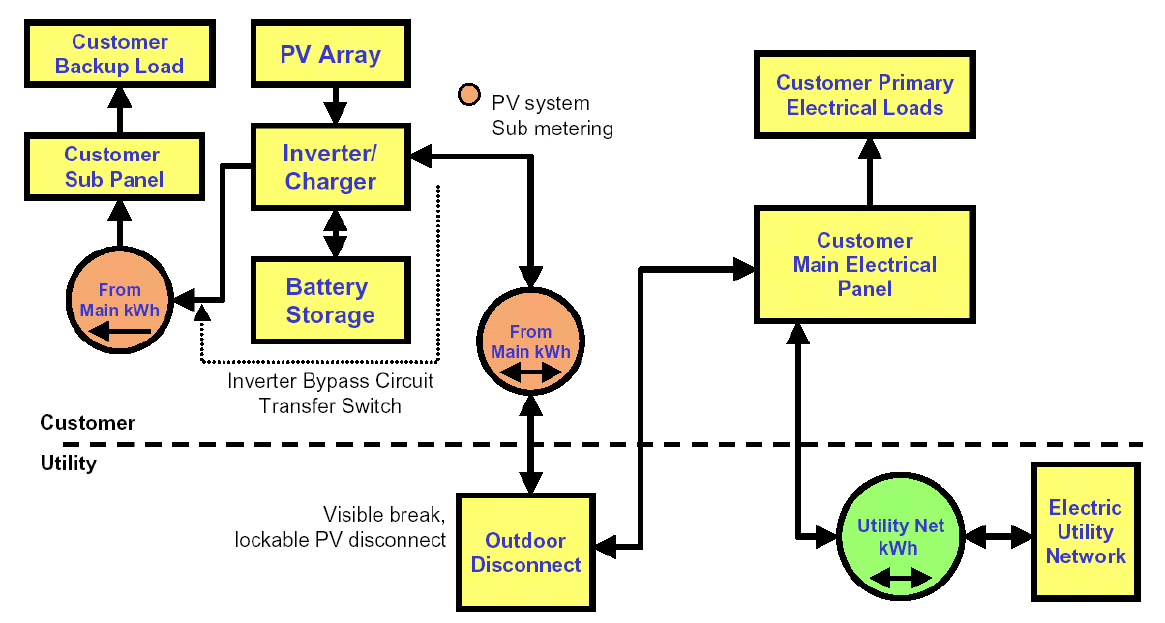
Utility Interactive PV with battery storage-Net Metering.
PV System works in Parallel and synchronously with the utility grid
PV System supplements on site energy usage, electrical loads are supplied either by the PV System or by the utility, depending on the amount of PV Generation and magnitude of the load.
Two Net Utility Revenue Meters are required or a single bi-directional recording meter. One meter records energy delivered to the facility, for which customer pays retail value. Second meter records energy delivered to the utility grid for which the customer is credited wholesale value of the electricity.
Some utilities require an accessible, outdoor disconnect for the PV System.

Utility Interactive PV System-with battery storage Dual Metering.
PV System works in Parallel and synchronously with the utility grid
PV System supplements on site energy usage, electrical loads are supplied either by the PV System or by the utility, depending on the amount of PV Generation and magnitude of the load.
Two Net Utility Revenue Meters are required or a single bi-directional recording meter. One meter records energy delivered to the facility, for which customer pays retail value. Second meter records energy delivered to the utility grid for which the customer is credited wholesale value of the electricity.
Some utilities require an accessible, outdoor disconnect for the PV System.

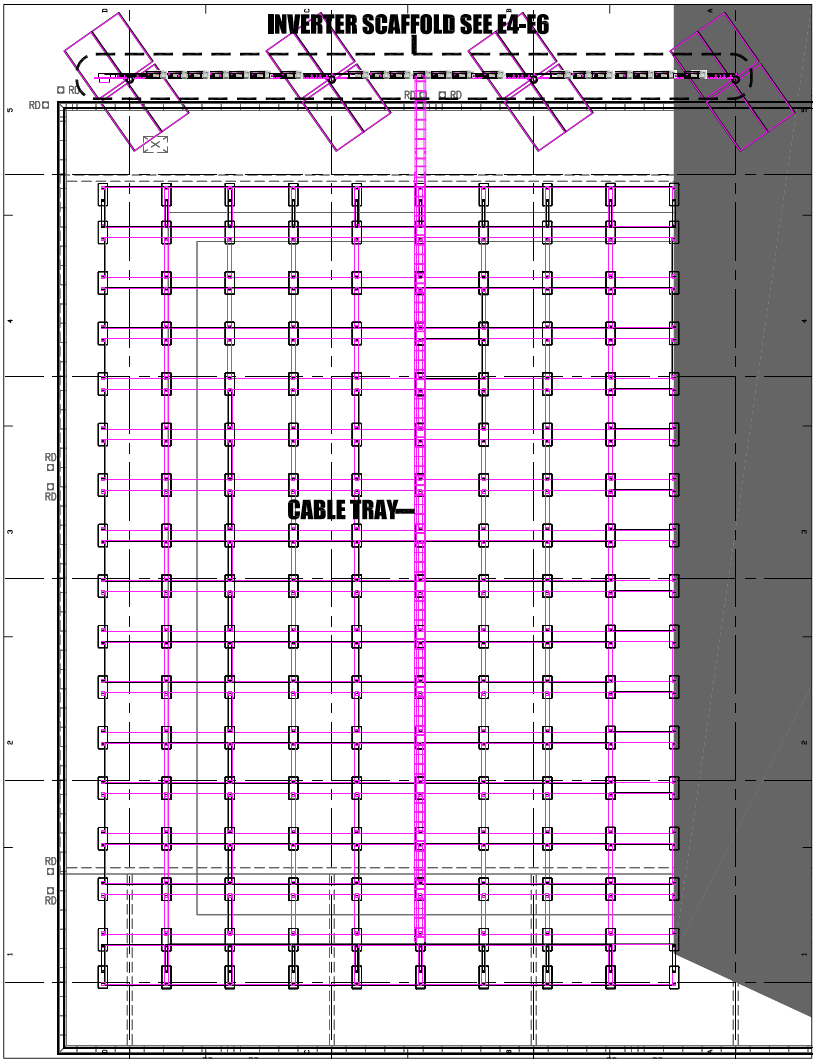
Schematic plan showing cable tray location under solar modules.
